Remove news integrate-dynatrace-more-easily-using-the-new-metrics-rest-api
article thumbnail

Dynatrace simplifies StatsD, Telegraf, and Prometheus observability with Davis AI

Dynatrace

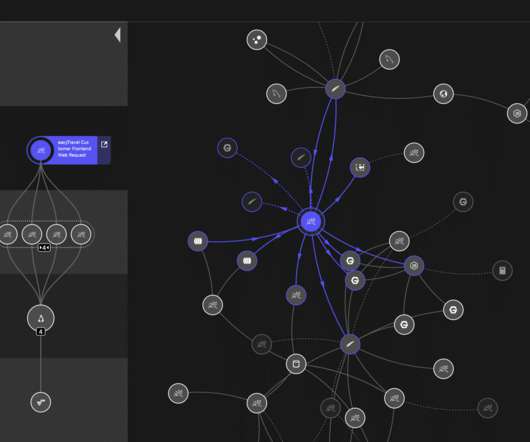
Dynatrace news. Moreover, Dynatrace has introduced enterprise-grade security features and encryption to the mix. Open-source metric sources automatically map to our Smartscape model for AI analytics. We’ve just enhanced Dynatrace OneAgent with an open metric API. Davis AI analyzes your StatsD metrics.

article thumbnail

Flexible, scalable, self-service Kubernetes native observability now in General Availability

Dynatrace

Dynatrace news. Dynatrace Cloud Native Full Stack injection for Kubernetes, now officially released, provides unparalleled flexibility and scale for onboarding teams to AI-powered observability. The foundation of this flexibility is the Dynatrace Operator ¹ and its new Cloud Native Full Stack injection deployment strategy.

Insiders

Sign Up for our Newsletter

This site is protected by reCAPTCHA and the Google Privacy Policy and Terms of Service apply.

Trending Sources

article thumbnail

Leverage the new Problems API to resolve Dynatrace-detected issues faster in your third-party tools

Dynatrace

Dynatrace news. Dynatrace v2 APIs transform your entire organization by making it easy to get started with monitoring automation and to solve your business problems with data-driven answers. Today we’re happy to announce a further API that will make your life easier: our brand new Problems REST API v2.

Metrics 245
article thumbnail

Scale your API operations with our version 2 APIs

Dynatrace

Dynatrace news. Dynatrace v2 APIs transform your entire organization by making it as easy as possible to get started with monitoring automation and to solve your business problems with data-driven answers. Every-team API : We want to provide API success for all teams that want to make data-driven business decisions.

Metrics 186
article thumbnail

Automate complex metric-related use cases with the Metrics API version 2

Dynatrace

Dynatrace news. Dynatrace collects a huge number of metrics for each OneAgent-monitored host in your environment. Depending on the types of technologies you’re running on individual hosts, the average number of metrics is about 500 per computational node. Creating customized metric reports. GET /metrics.

Metrics 226
article thumbnail

Go web-scale by providing Dynatrace Managed as a service to your teams

Dynatrace

Dynatrace news. “I I now have 20 teams using Dynatrace. I will then have to onboard more than 150 teams to Dynatrace! A Dynatrace customer. Dynatrace Managed provides all the power of a Dynatrace SaaS environment while keeping your data on-premises.

Cloud 205
article thumbnail

Simplify observability for all your custom metrics (Part 3: Scripting languages)

Dynatrace

Dynatrace news. In Part 1 we explored how you can use the Davis AI to analyze your StatsD metrics. In Part 2 we showed how you can run multidimensional analysis for external metrics that are ingested via the OneAgent Metric API. Example use case: G et various CPU metrics per processor.

Metrics 149