
Dynatrace now uses its patented PurePath® technology to automatically combine logs streamed through Fluentd with distributed traces. In the past, Dynatrace enriched Fluentd logs with Kubernetes metrics, events, and topology information such as workloads, pods, namespaces, and nodes for easy filtering and analysis. Now, traces provide a transaction centric view and make Fluentd logs even more actionable in complex Kubernetes environments. Having all observability data available in context provides DevOps and platform teams with a new level of visibility and insights. And it enables Davis, the Dynatrace AI engine, to pinpoint the root causes of anomalies across the full stack, automatically and in real time.
What is Fluentd?
Fluentd is an open-source data collector that unifies log collection, processing, and consumption. It collects, processes, and outputs log files to and from a wide variety of technologies. The result is an easily configurable log pipeline that supports a continuously expanding set of plugins:
- Input plugins collect logs from pods, apps, DBs, load balancers, etc.
- Processing plugins parse (normalize), filter, enrich (tagging), format, and buffer log streams
- Output plugins deliver logs to storage solutions, analytics tools, and observability platforms like Dynatrace
Fluentd can run as a DaemonSet in a Kubernetes cluster. Its behavior can be controlled via a fluentd.conf file. Built-in resiliency ensures data completeness and consistency even if Fluentd or an endpoint service goes down temporarily.
While Fluentd solves the challenges of collecting and normalizing Kubernetes events and logs, Kubernetes performance and availability problems can rarely be solved by investigating logs in isolation. Moreover, domain knowledge is required to sift through the vast amount of disconnected log files and find the proverbial needle in the haystack.
Bring the full value of Dynatrace to Fluentd
By treating Fluentd as a first-class citizen, Dynatrace brings its full platform power to bear: best-in-class end-to-end observability, automated anomaly detection, and AI-powered root-cause determination.
The Dynatrace platform is substantially different because it automatically captures the topology and dependencies of an environment. By linking all observability data—including Fluentd logs—into meaningful context with each monitored entity, the causal relationship between observability data can be modeled and understood, which enables:
- Significantly faster ad-hoc problem debugging by analyzing Fluentd logs in the full context of topology, metrics, traces, user sessions, and more.
- Precise, AI-powered anomaly root-cause determination based on automatic log analysis and custom user-defined events.
- Detailed performance analysis for better software architecture and resource allocation
For example, say you find multiple error events in different log files. Time-based correlations can only tell you that there is some concurrency. But given the hundreds of pods and processes in modern systems, these errors might not be logically connected. Dynatrace eliminates this ambiguity by indicating the error events that are truly related. All metrics, traces, and real user data are also surfaced in the context of specific events.
With Dynatrace, you can create custom metrics based on user-defined log events. For example, you can count specific error or alert events and chart them, create Service Level Indicators for SLO tracking, or feed the events back to the Dynatrace Davis AI-engine for refined root-cause analysis.
Should I use Fluentd or OneAgent for Kubernetes?
To be clear, you don’t need Fluentd to capture Kubernetes logs. The Dynatrace Operator for Kubernetes includes a native OneAgent DaemonSet that serves as a fantastic log agent. So, let’s compare the two approaches for ingesting logs.
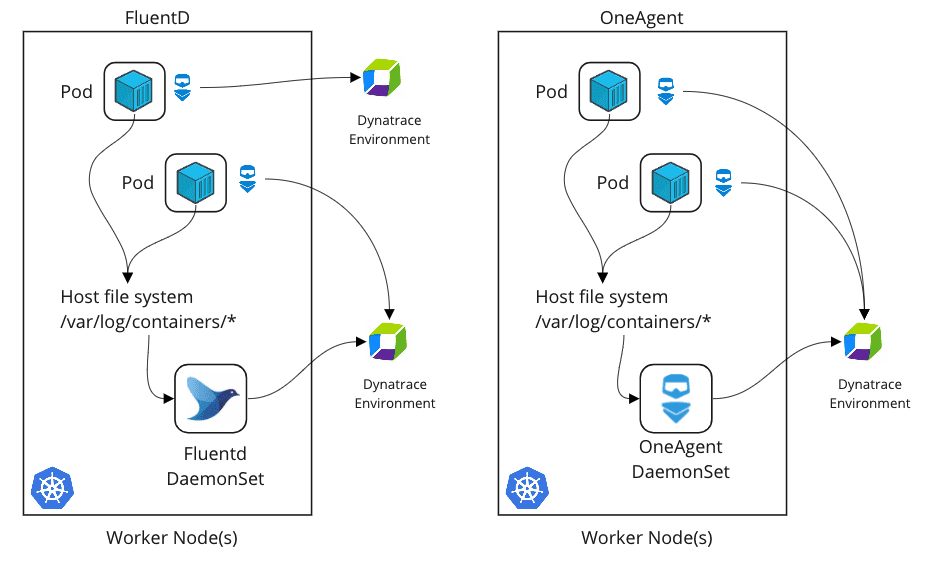
First and foremost, both approaches equally enrich Kubernetes logs with metadata for enhanced analytics. Both approaches automatically add pod name, namespace, container name, tags, labels, and more to each log file. In addition, logs are enriched with associated transaction traces. This enables all the advanced use cases described above.
The main advantage of using the Dynatrace OneAgent approach is its ease of deployment. Log monitoring works out-of-the-box with no further configuration needed. The Dynatrace Operator automates the roll-out of all Dynatrace components, including the OneAgent DaemonSet, across clusters and manages all aspects of observability.
Fluentd, on the other hand, offers a large ecosystem of plugins and the flexibility of log processing pipelines. If you’re already using Fluentd and are happy with it, the Fluentd approach might make the most sense for you. Adding the Dynatrace plug-in is easy. Fluentd also enables two advanced use cases:
- You can stream logs to different Dynatrace environments from the same Kubernetes cluster. For example, you can send application pod logs to a different environment than the Kubernetes node logs.
- Support for streaming logs in application-only integrations.
Fluentd logs in context: Example use cases
Workload performance and resource utilization
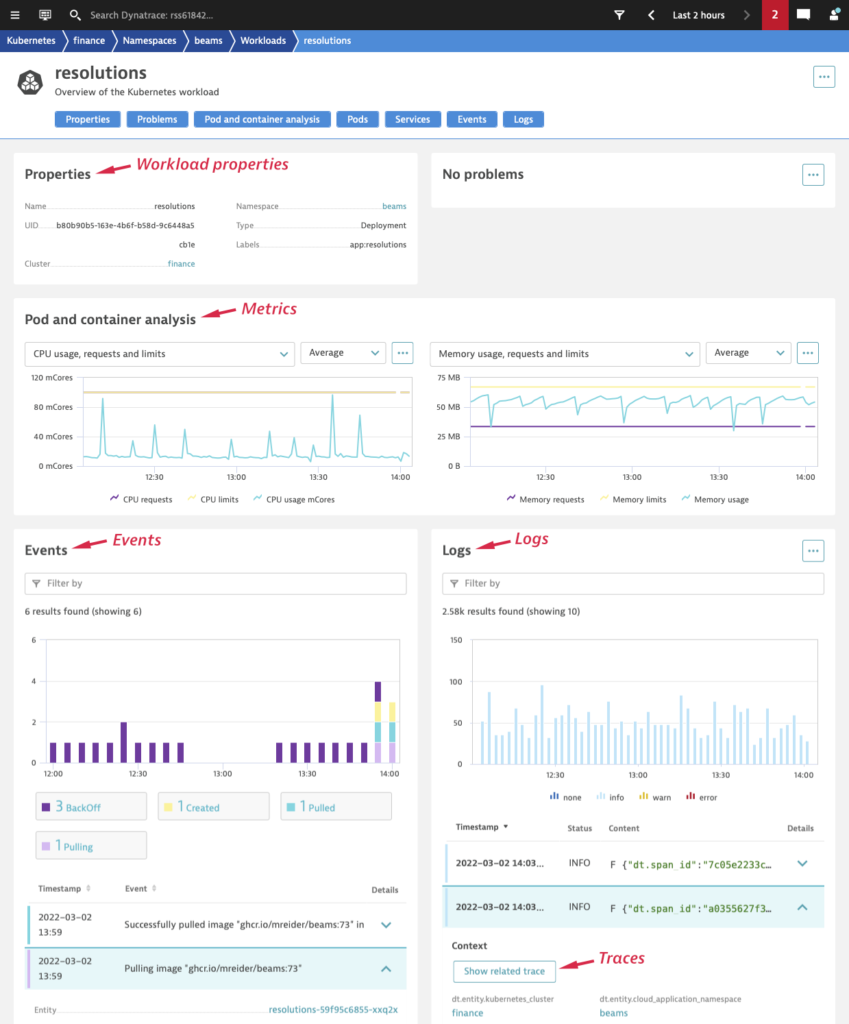
The following Kubernetes workload overview page is a powerful example of the kind of insights you get with all relevant data in one place: workload properties, pod and container metrics (for example, CPU and memory utilization), services metrics (for example, response time and failure rate), and Kubernetes events and logs. The logs are expandable and show the payload, all metadata, attributes, and related traces. With all this data in one place, it’s easy to optimize resource limits or understand the service performance under varying load conditions.
Transaction breakdowns
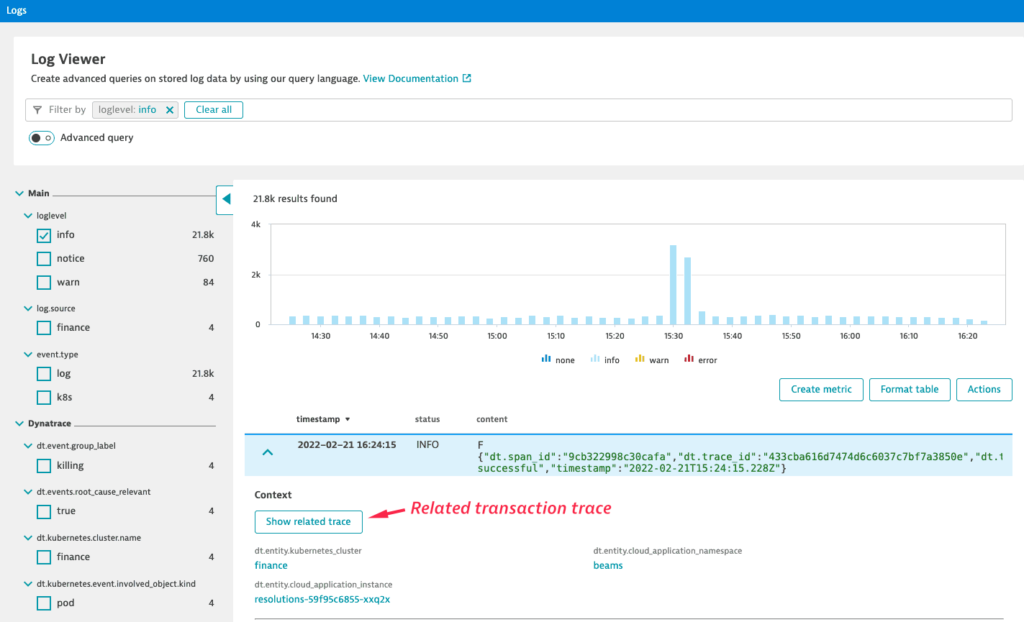
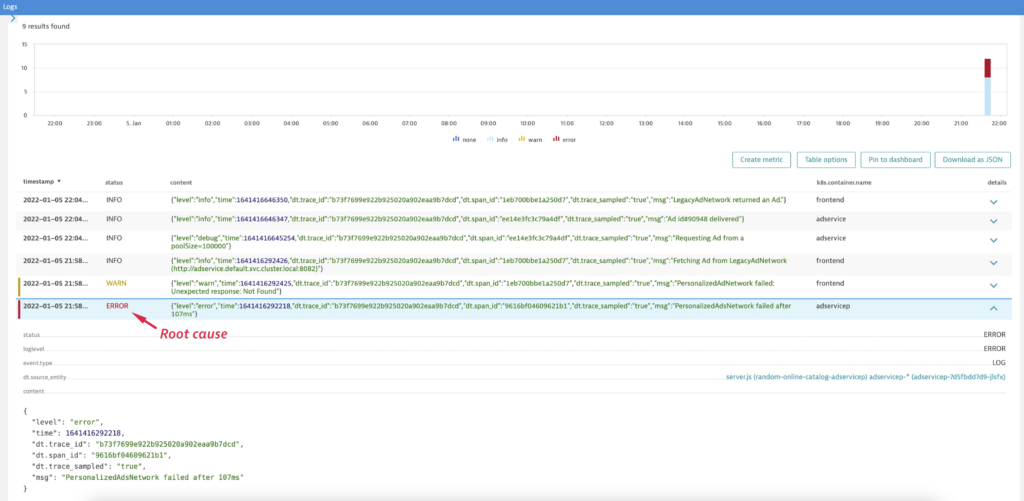
With multiple microservices involved in a single user transaction, the true root cause of a breakdown can be hard to find. In such cases, you can select the logs of one workload, find the entire transaction, and display all logs related to that transaction. This way, it’s easy to spot and understand the source of problems.
To get started, expand any log entry in the Log Viewer and select Show related trace to navigate to the related trace.
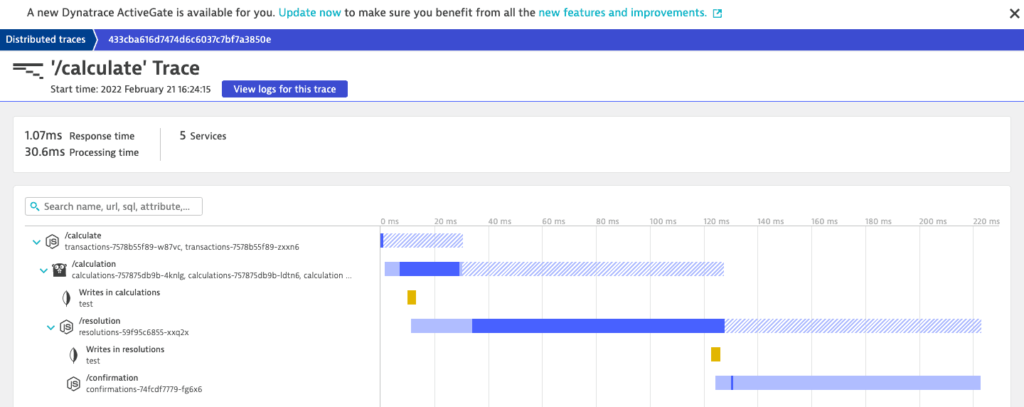
Then, on the corresponding distributed trace overview page, select View logs for this source to display all logs related to the distributed transaction.
Set up alerting for recurring log patterns
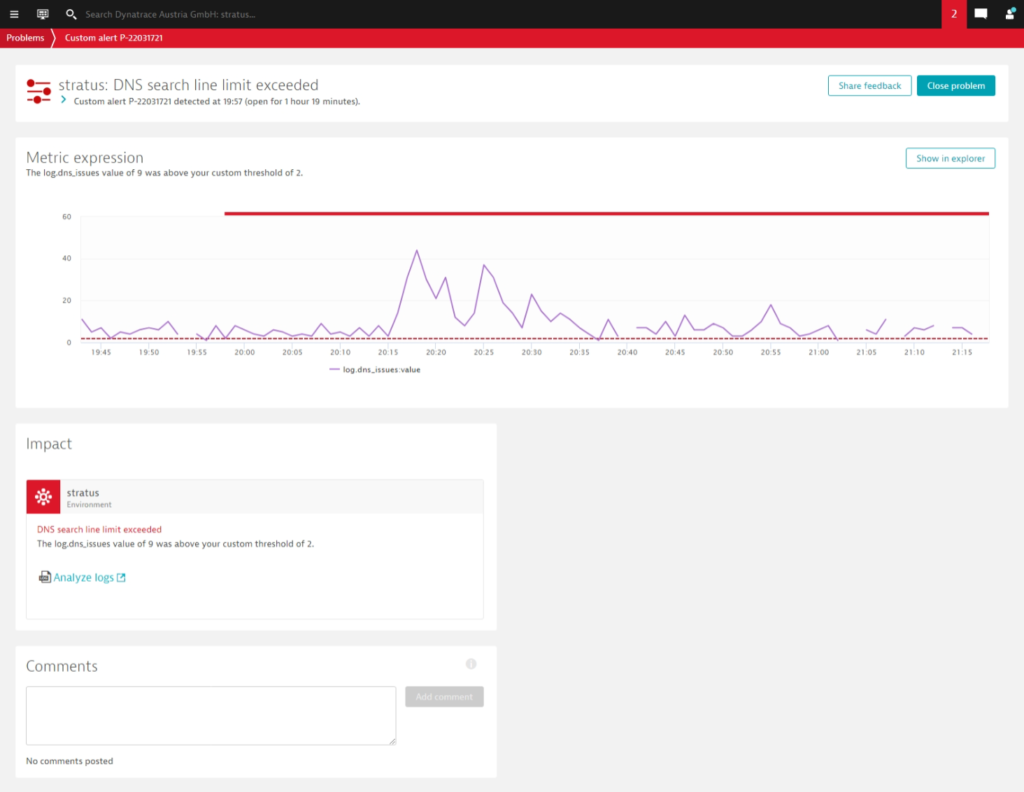
Dynatrace has long provided automatic baselining, alerting, and root-cause analysis for a wide range of error conditions. Now you can use logs to create custom, application-specific alerts. In the example below, a user configured Davis to alert on problems with DNS queries in a Kubernetes cluster. To accomplish this, the user recoded DNS query responses in a dedicated log file and created a custom metric for the number of search lines with an alerting threshold of 2. With this simple configuration, Davis automatically creates a problem ticket whenever the defined anomaly occurs. Take a look at this blog post to learn more about how to transform log data into actionable metrics and have Davis AI do the work for you.
In summary, these examples show that:
- Logs, whether ingested through Fluentd or OneAgent, significantly improve the observability of complex Kubernetes environments.
- Dynatrace automatically enriches logs with metadata and analyzes them in context with corresponding metrics and traces.
- Context and topology mapping are essential for both automatic and ad hoc root-cause analysis.
- Logs can be used to enhance Davis AI analysis with application-specific problem patterns.
Get started today
Deploying the Dynatrace Fluentd output plugin is easy. You’ll find detailed instructions on both the Dynatrace Hub and GitHub.
There is also an excellent video tutorial available on the Is It Observable YouTube channel.
Kubernetes in the wild report 2023
This Kubernetes survey shows how organizations actually use Kubernetes in production. The study analyzes factual Kubernetes production data from thousands of organizations worldwide that are using the Dynatrace Software Intelligence Platform to keep their Kubernetes clusters secure, healthy, and high performing.


Looking for answers?
Start a new discussion or ask for help in our Q&A forum.
Go to forum