
Metric expressions help you create actionable insights to meet the needs of disparate SRE, DevOps, and business teams.
Observability implies actionability. Or at least it should, but we know that’s not always the case. Maybe a better statement is “Good observability is actionable.” Because without appropriate context, the so-called pillars of observability—metrics, logs, and traces—are simply sources of data, not insights. For metrics in particular, important context includes dimensions, relationships to other metrics, and metadata. Consider the seemingly countless metrics derived from modern container orchestration systems; these are not only numerous but also dynamic. It’s almost impossible for humans to make sense of these without context. For reasons like these, it has become the responsibility of monitoring and observability solutions to extract and apply the context needed to transform metrics into actionable insights.
While many of these insights are built in to monitoring solutions, it’s understandably difficult to anticipate the evolving and dynamic observability and alerting needs of disparate SRE, DevOps, and business teams. Without flexible, on-demand metric calculations, customers are limited to static, predefined metrics. Transforming these to meet the needs of diverse audiences would require external processing, adding unnecessary costs and complexity.
On-demand metric calculations
The Metric API v2 introduced metric selectors, providing the ability to filter, aggregate, and transform metrics, eliminating much of the need for custom post-processing. Metric expressions advance this value to deliver on-demand metric calculations—through the API, for charting, and for anomaly detection. Metric expressions allow you to define the precise context you need to deliver actionable insights.
In a previous blog post on metric expressions we introduced the Data explorer, the user interface for building, testing, and creating your own metric calculations. We included a few use cases to illustrate the value and will add a few more here.
Metric expressions: calculation examples
Currency conversion
For reporting or alerting purposes, you might want to convert a foreign currency to your local currency. The inputs shown below include business metrics—revenue from individual shops—and rate metrics for relevant currencies.
business.shop.revenue,country=us,region=useast,city=Charlotte,store=shop1 38
business.shop.revenue,country=us,region=useast,city=Jacksonville,store=shop2 31
business.shop.revenue,country=us,region=useast,city=Indianapolis,store=shop3 67
business.currency.conversion,from=USD,to=EUR 0.8473140145738011
business.currency.conversion,from=EUR,to=USD 1.1802
business.currency.conversion,from=USD,to=GBP 0.7227419081511608
business.currency.conversion,from=GBP,to=USD 1.3836197800651833
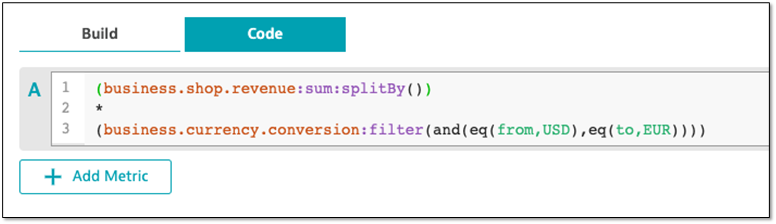
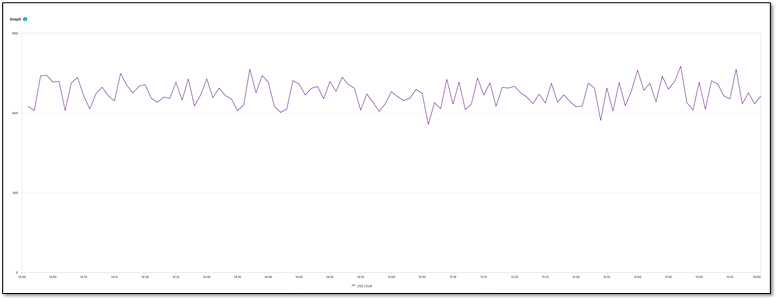
The Data explorer Code tab shown below first sums the revenue from all shops. The revenue is then multiplied by the conversion rate metric, filtering on the desired currency conversion—from USD to EUR. This metric query creates an on-demand metric that can be charted and used on a dashboard to show revenue in Euros.
Calculate successful Azure ServiceBus queue requests
The Azure Monitor offers a REST API that supports many discrete metrics, including incoming requests and successful requests. To transform these raw metrics into something more actionable, you can calculate the percentage of successful requests, thereby creating an on-demand metric with the context needed for an informative KPI.
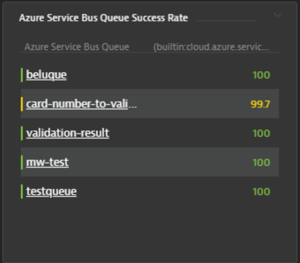
For this example, we calculate the percentage of successful requests for each named ServiceBus queue by dividing successful requests by total requests and then multiplying by 100.
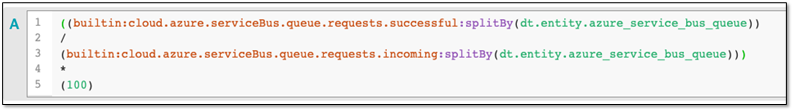
In this metric expression query, we split each metric by the queue dimension so that the arithmetic calculation is performed for each monitored queue. The resulting chart shows the percentage of successful requests per queue.
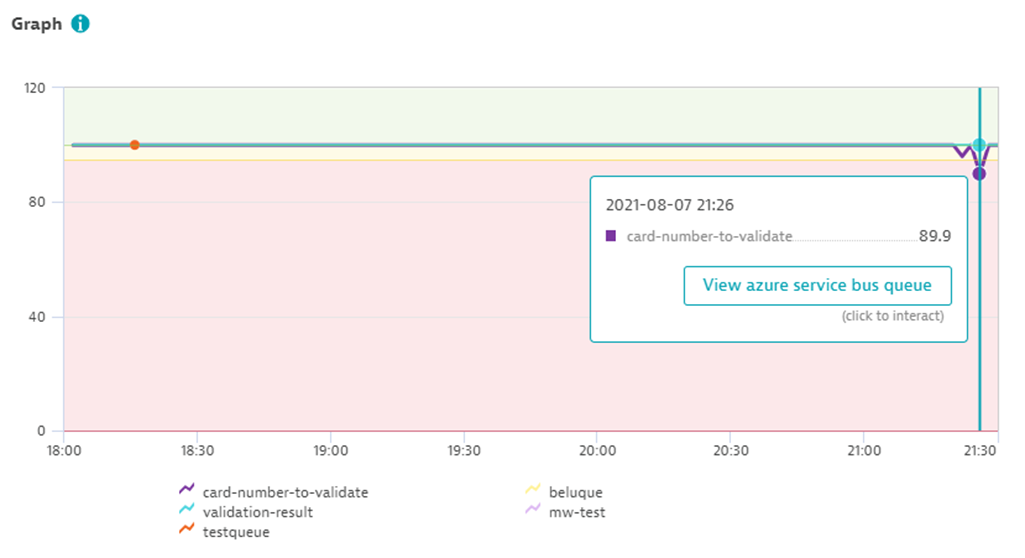
We can then pin the chart to the dashboard or display the data in table form.
Too many queues to report? Maybe you only want to report the most problematic queues. Metric expressions make this easy: sort the query by the percentage value in ascending order and then limit the results to the desired number. Similarly, if you only want to report on specific named queues, use the queue names as filters.
Metric expressions: alerting examples
As you can see, metric expressions provide a powerful means of transforming raw metrics into actionable insights. For the same reasons, you might also consider using metric expressions for custom alerting.
Alert when running Kubernetes pods fall below a desired number
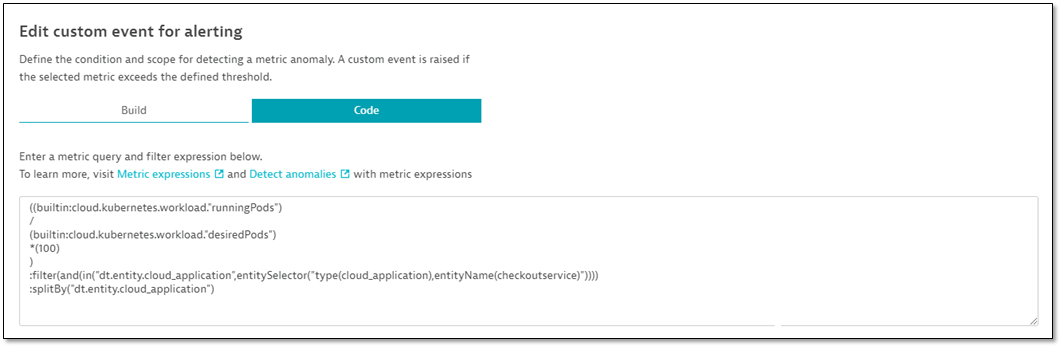
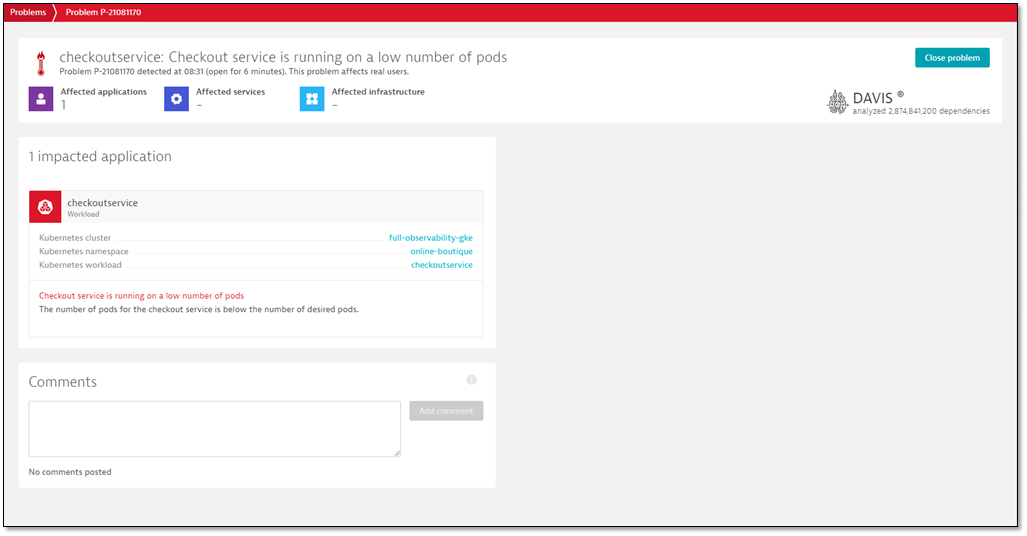
Let’s say you want to receive an alert when the number of running pods supporting a checkout service falls below the number of desired pods. As the number of desired pods is dynamic, the number of running pods alone doesn’t provide enough information to define the alert. Instead, we use a metric expression—running pods / desired pods—to define a new on-demand metric. Simply copy the metric expression code from the Data explorer into the custom alert definition. Davis will automatically evaluate the results of the metric query and suggest a static threshold based on the previous 24 hours.
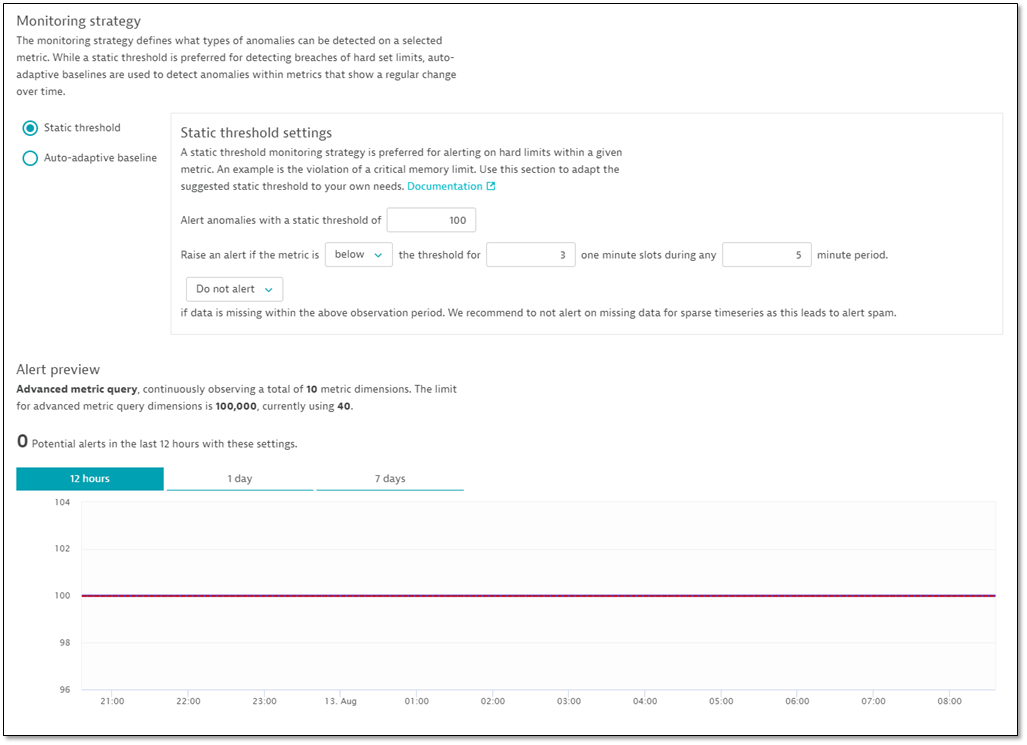
As we’d likely want our running pods to equal 100% of the desired pods, a static baseline is most appropriate. But there are many cases where the reference value for detecting anomalies changes over time; for these, you should choose an auto-adaptive baseline.
Alerting on excessive log errors
In many containerized environments, it’s impractical to define unique alerts for each monitored log; the number of log files might scale dynamically, and the error count might differ significantly from one log to the next, requiring unique thresholds for each log file. Even if you did this, individual alerts don’t tell the complete story.
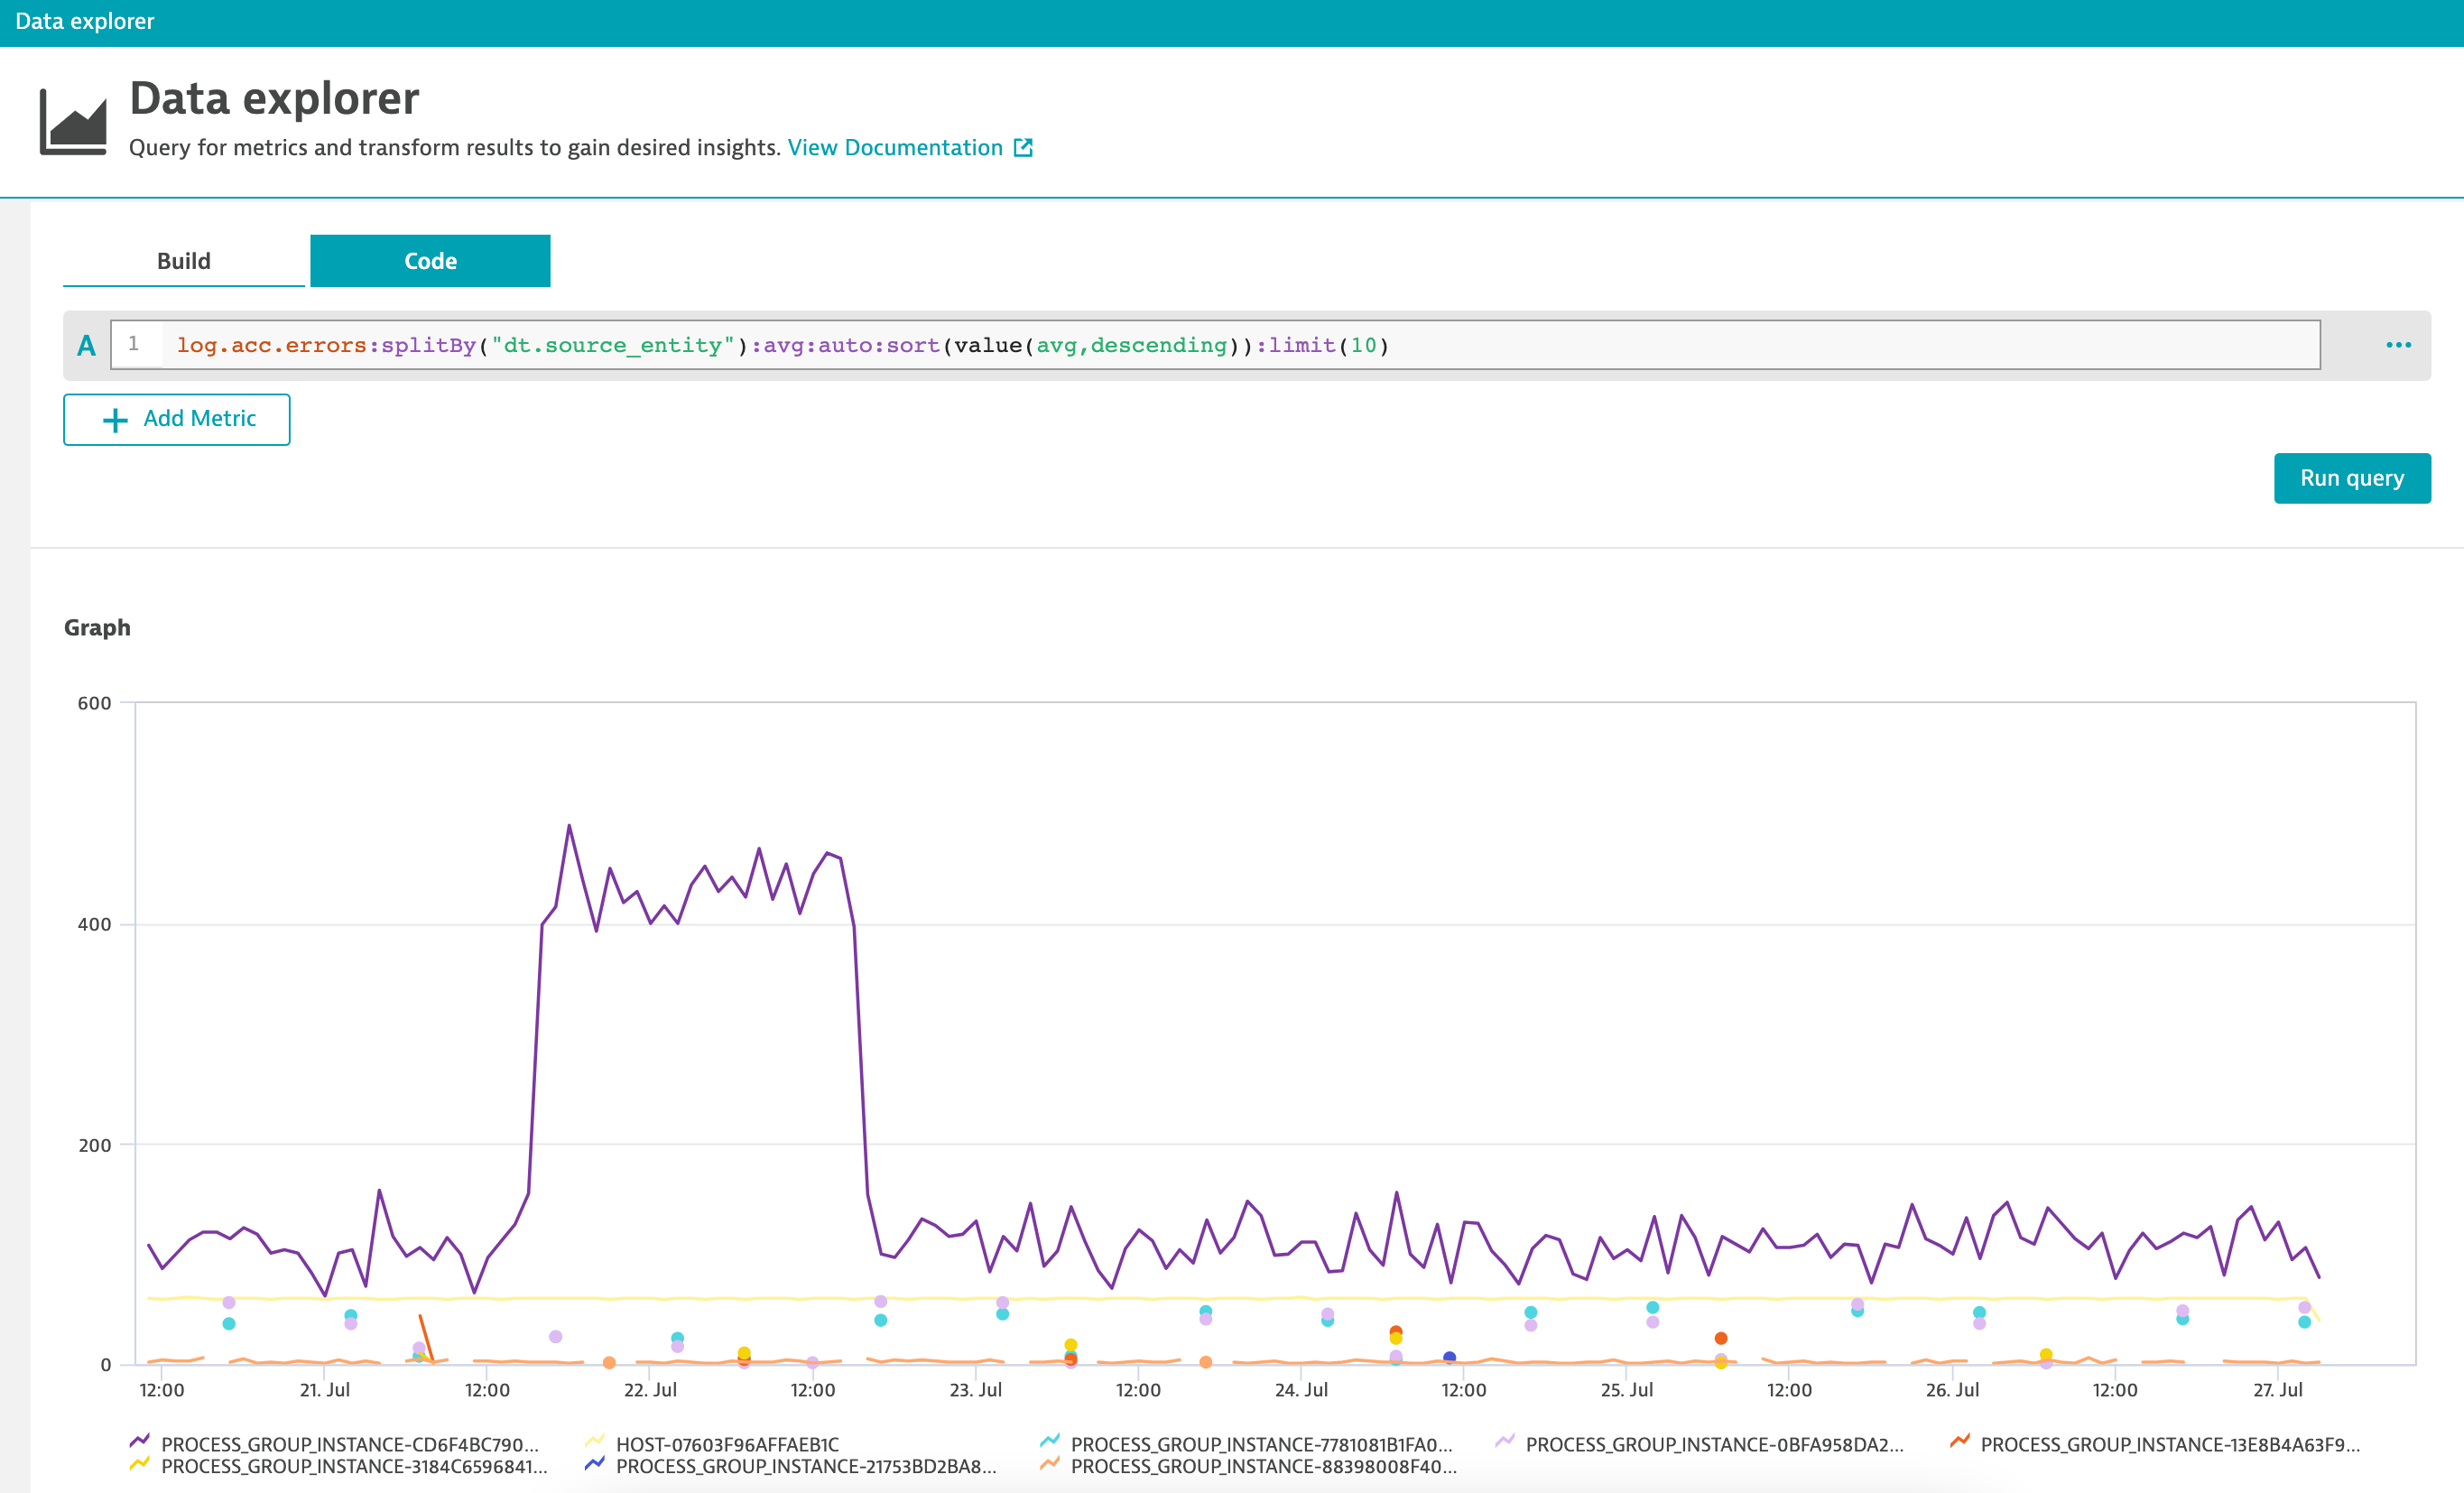
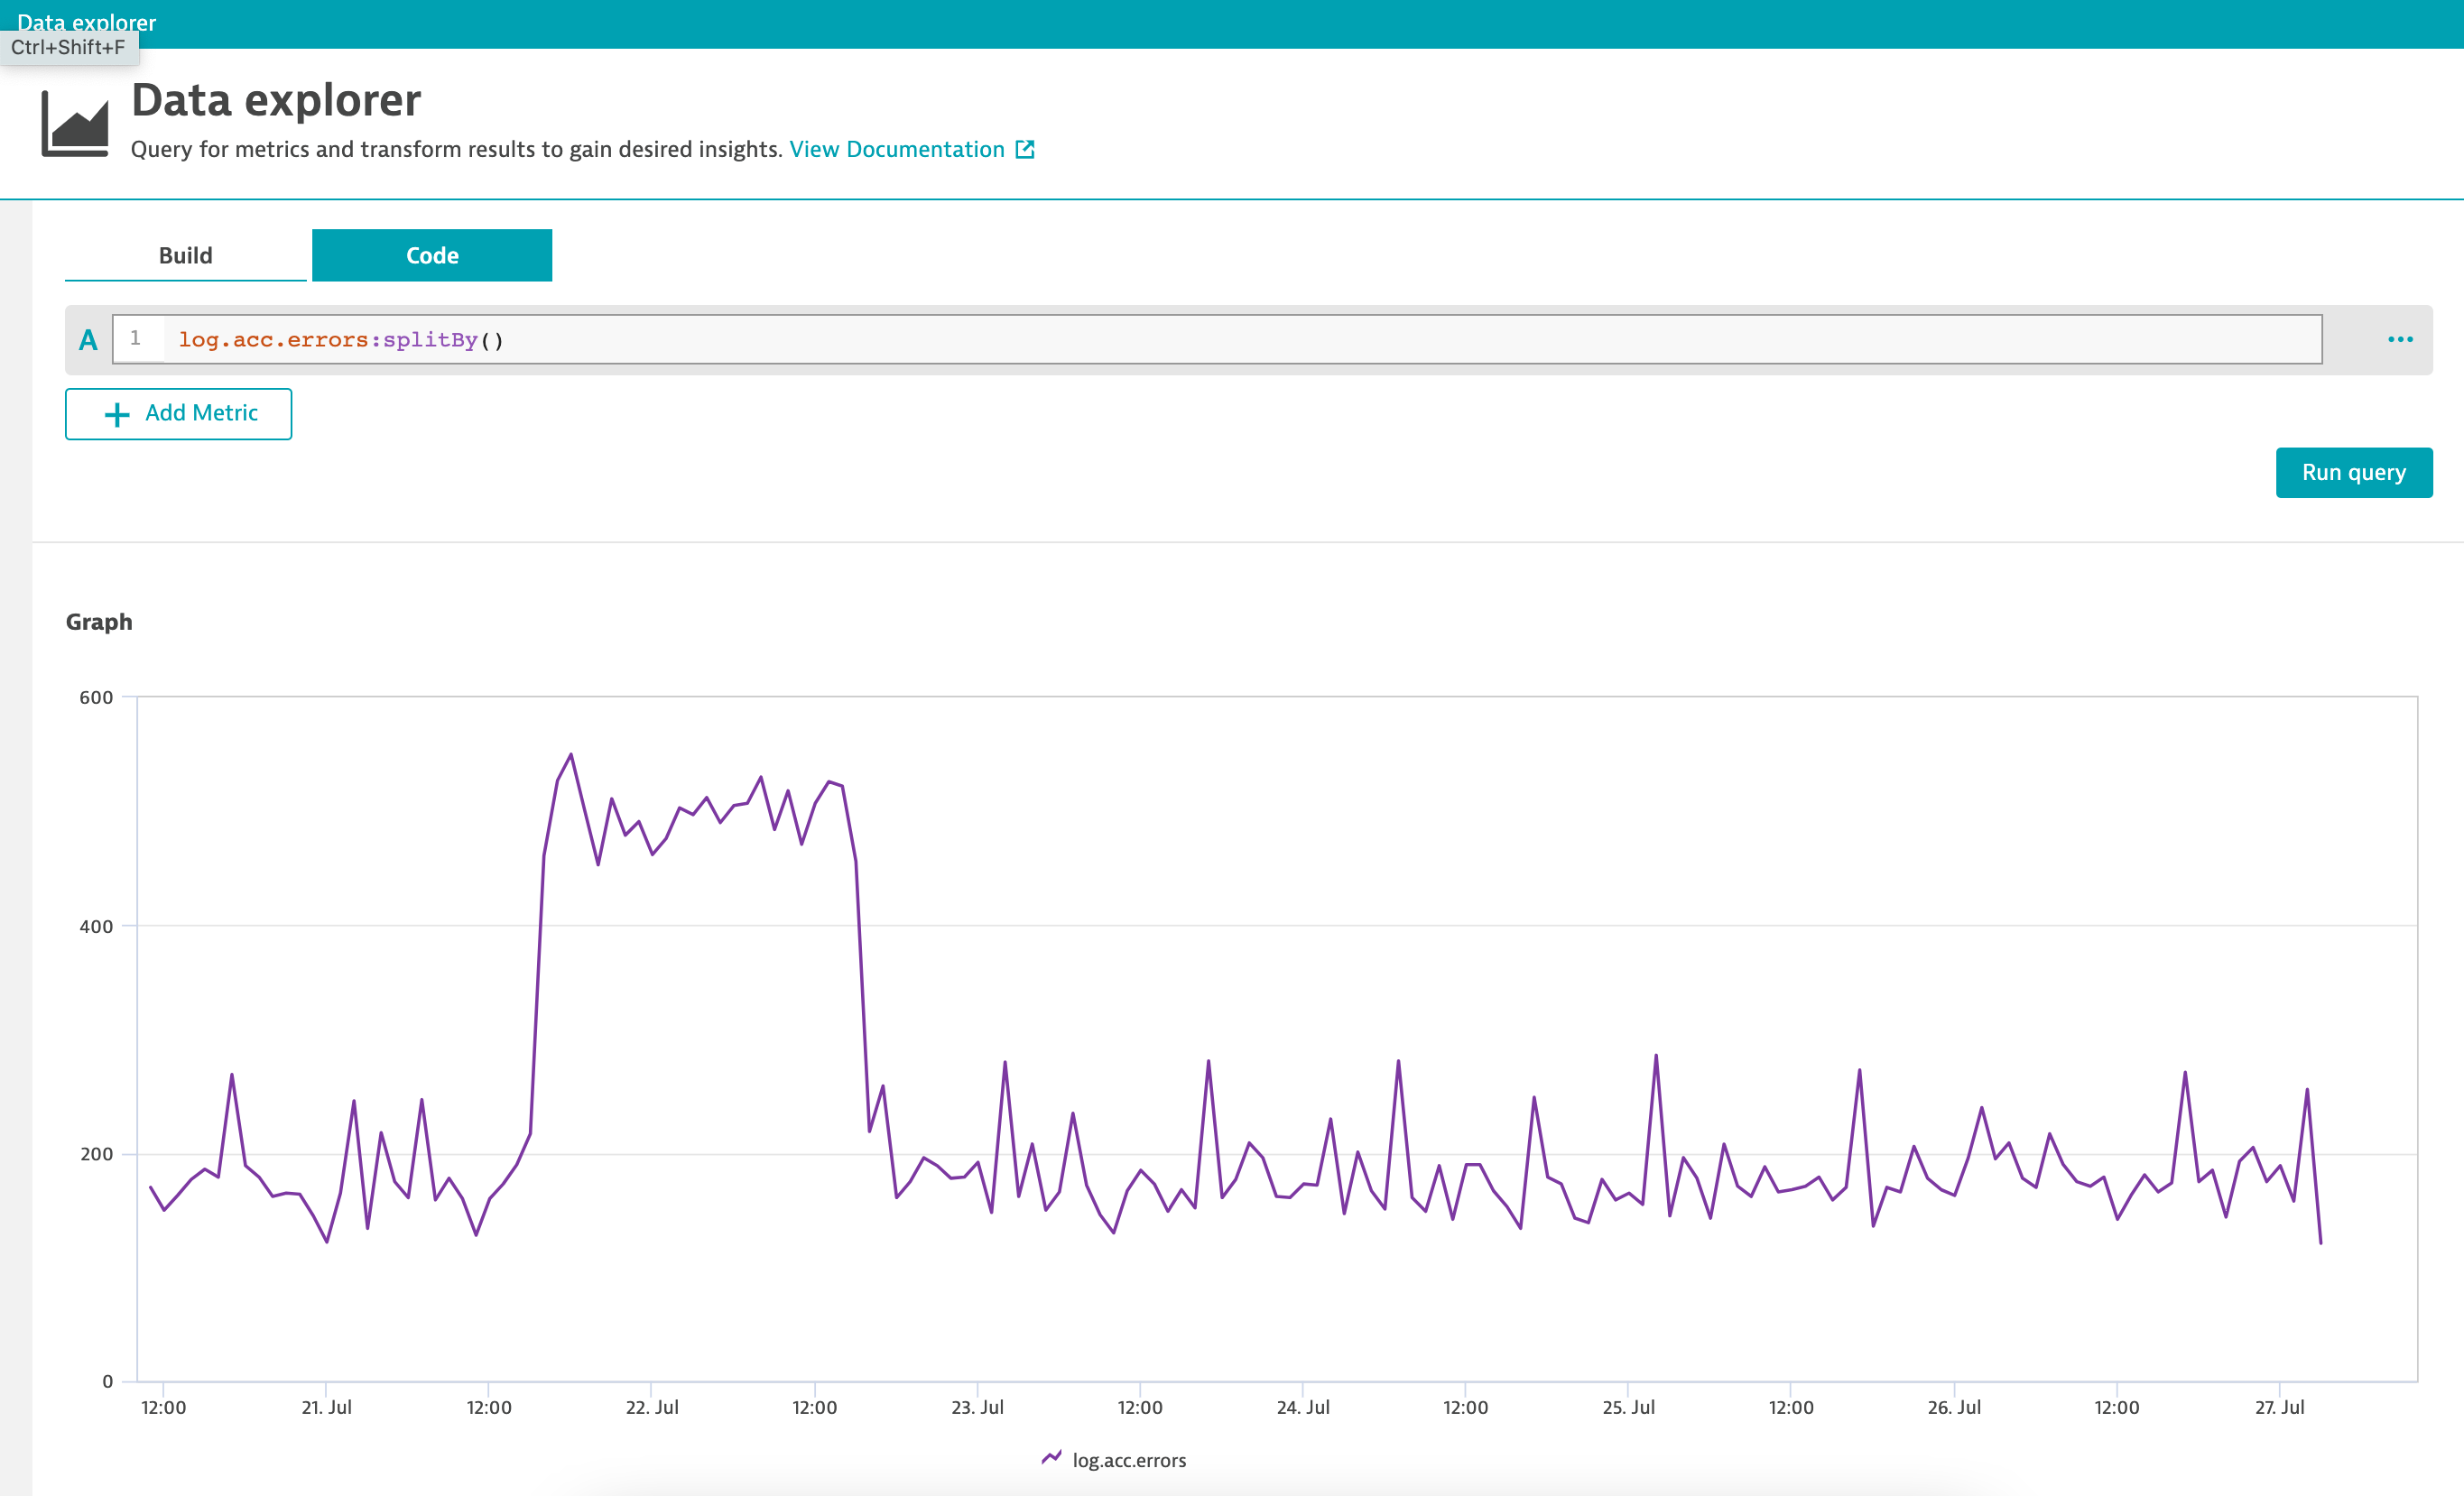
Instead, use a metric expression to aggregate errors across all log instances and use this to define your alert. Davis will evaluate the results of the metric expression instead of the individual log-error metrics.
The first chart below treats each monitored log individually. Without aggregation, defining individual alerts would be difficult. The second chart aggregates errors from all monitored logs—even as they come and go—simplifying alert definition and delivering actionable insights.
Try it out today
Introduced with Dynatrace version 1.222, metric expressions are already available to you. Give them a try today using the Data explorer, then consider how metric expressions can increase the actionability of your custom dashboards and alerting profiles. To see metric expressions in action, view this Performance Clinic on YouTube. And watch for our next metric expressions blog post to see how on-demand calculations level up your SLOs.
New to Dynatrace?
If so, start your free trial today!


Looking for answers?
Start a new discussion or ask for help in our Q&A forum.
Go to forum