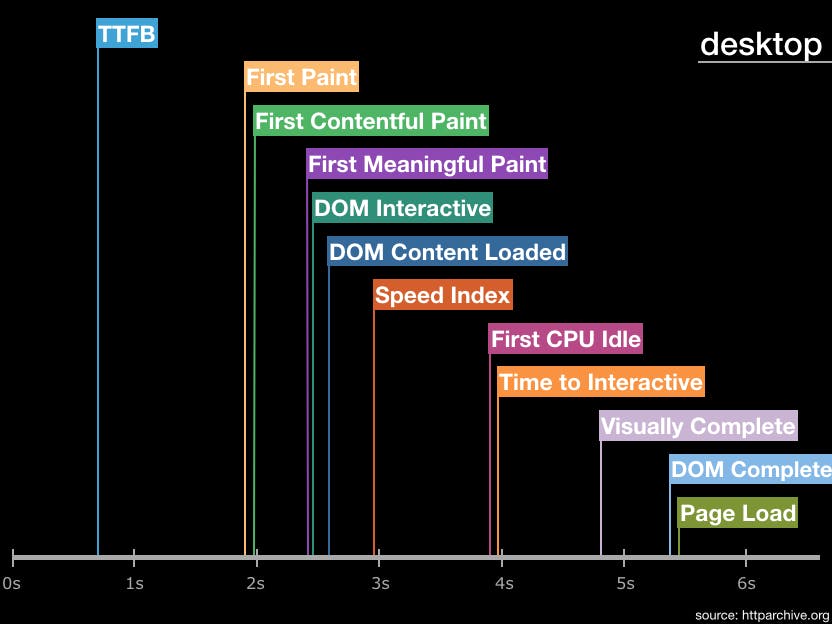
Metrics from 1M sites

The number of performance metrics is large and increases every year. It's important to understand what the different metrics represent and pick metrics that are important for your site. Our Evaluating rendering metrics post was a popular (and fun) way to compare and choose rendering metrics. Recently I created this timeline of performance metric medians from the HTTP Archive for the world's top ~1.3 million sites:
Here's the same chart for mobile:
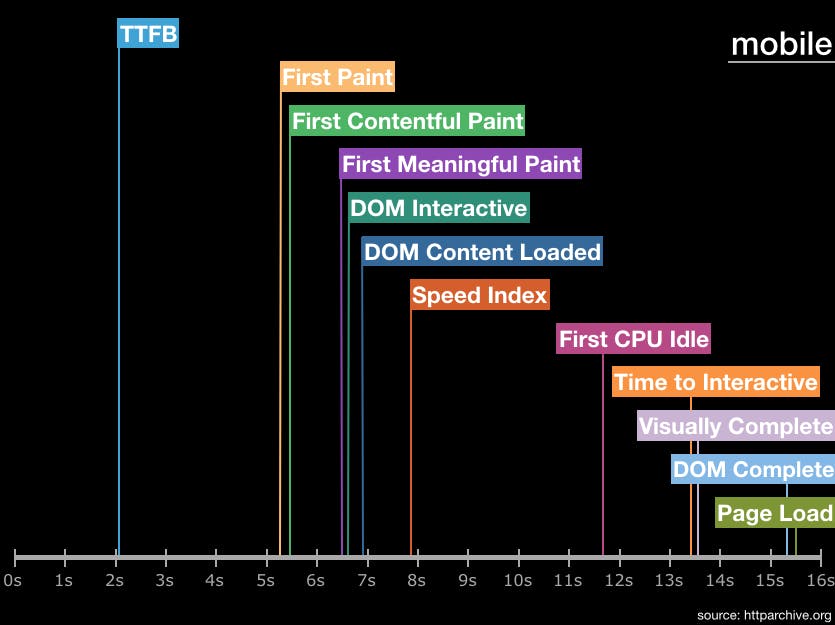
People who have worked on web performance won't be surprised by how much slower mobile is. As much as we hear about improvements to mobile networks and CPUs, they're not on par with desktop. And yet, many sites deliver the same amount of content (especially JavaScript) to mobile devices.
What catches my eye are the gaps between TTFB and the paint metrics, and between the paint metrics and First CPU Idle. These gaps are caused by JavaScript dominating the browser main thread. This happens after TTFB when all the blocking scripts are executed – these have to finish before any rendering can happen. The gap between the paint metrics and First CPU Idle is caused by subsequent scripts being executed and JavaScript frameworks building the DOM dynamically.
If you're looking for guidelines on where your metrics should be, these timelines provide a useful guide. Stay tuned for more posts that explore how to make JavaScript faster so it's no longer the longest pole in the tent (or at least shorten the pole).
Related posts:
- Ouch, your JavaScript hurts!
- An analysis of Chromium's paint timing metrics
- Evaluating rendering metrics
Read Next

See how customers are using SpeedCurve to make their sites faster.

See industry-leading sites ranked on how fast their pages load from a user's perspective.