article thumbnail

Monitoring Web Servers Should Never Be Complex

DZone

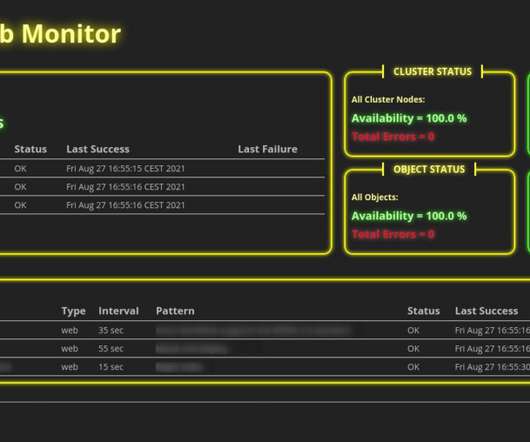
If you run several web servers in your organization or even public web servers on the internet, you need some kind of monitoring. If your servers go down for some reason, this may not be funny for your colleagues, customer, and even for yourself. Introduction. For that reason, we use monitoring tools.

article thumbnail

The Various Methods to Backup and Restore ProxySQL

Percona

The daemon accepts incoming traffic from MySQL clients and forwards it to backend MySQL servers. These include runtime parameters, server grouping, and traffic-related settings. These include runtime parameters, server grouping, and traffic-related settings.

Traffic 114
Insiders

Sign Up for our Newsletter

This site is protected by reCAPTCHA and the Google Privacy Policy and Terms of Service apply.

Trending Sources

article thumbnail

What is cloud migration?

Dynatrace

It requires purchasing, powering, and configuring physical hardware, training and retaining the staff capable of servicing and securing the machines, operating a data center, and so on. They need enough hardware to serve their anticipated volume and keep things running smoothly without buying too much or too little. Reduced cost.

Cloud 165
article thumbnail

MySQL Key Performance Indicators (KPI) With PMM

Percona

As a MySQL database administrator, keeping a close eye on the performance of your MySQL server is crucial to ensure optimal database operations. However, simply deploying a monitoring tool is not enough; you need to know which Key Performance Indicators (KPIs) to monitor to gain insights into your MySQL server’s health and performance.

article thumbnail

Save Money in AWS RDS: Don’t Trust the Defaults

Percona

Recently I was engaged in a MySQL Performance Audit for a customer to help troubleshoot performance issues that led to downtime during periods of high traffic on their AWS RDS MySQL instances. The innodb_io_capacity_max parameter was set to 2000, so the hardware should be able to deliver that many IOPS without major issues.

AWS 124
article thumbnail

Crucial Redis Monitoring Metrics You Must Watch

Scalegrid

You will need to know which monitoring metrics for Redis to watch and a tool to monitor these critical server metrics to ensure its health. Understanding Redis Performance Indicators Redis is designed to handle high traffic and low latency with its in-memory data store and efficient data structures. <code> 127.0.0.1:6379>

Metrics 130
article thumbnail

Bring Your Own Cloud (BYOC) vs. Dedicated Hosting at ScaleGrid

Scalegrid

Each of these models is suitable for production deployments and high traffic applications, and are available for all of our supported databases, including MySQL , PostgreSQL , Redis™ and MongoDB® database ( Greenplum® database coming soon). This can result in significant cost savings for high traffic applications.

Cloud 242