
Third party APIs have become as essential to our software stack as your own code or the run-times your code runs on. If these 3rd parties become problematic, it will impact your software and users, causing complaints about your services not working as expected. That is why you must treat monitoring of these 3rd party APIs with the same priority as your own code or platforms your code runs on, using something like Dynatrace RUM to do so.
Depending on the type of 3rd Party API (internal vs external) and where in your stack you are leveraging that API (whether it be from the backend or your client) you can apply different approaches to monitoring these API endpoints and get alerted on problems and impact, e.g. Real User & Transaction Monitoring or Setup Synthetic Endpoint Checks.
While I could and will (in the summary section of this blog) point you to tutorials and documentation on how Dynatrace can be leveraged for API Monitoring, let me first tell you a story that was shared with me by Roman who leverages Dynatrace with one of our customers in the financial sector.
Custom Salesforce 3rd API impacting self-service portal
Roman and his team have recently rolled out Dynatrace to monitor some of their business-critical apps, including one of their self-service portals for insurance agents. It’s the same portal that can be used both within the internal network as well as for external agents.
While they have deployed the OneAgent only on parts of the backend systems that supports that portal, they have enabled Dynatrace Real User Monitoring (RUM) to monitor all external and internal users of that portal. The team wanted to do this to better understand problems their users have been reporting when working through the different self-service workflows.
The portal is accessible through different URLs depending on whether you come in as an external or internal users. Roman therefore configured two applications in Dynatrace mapping, each to the respective URL. This enabled him and his team to better understand who is accessing the application from inside or outside the corporate network and telling him whether there is any difference in user experience.
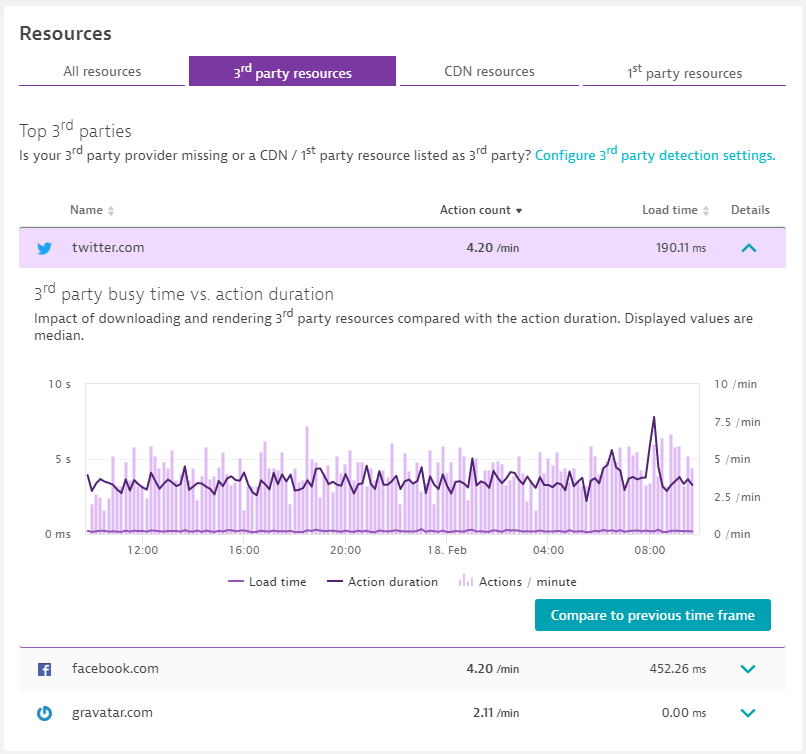
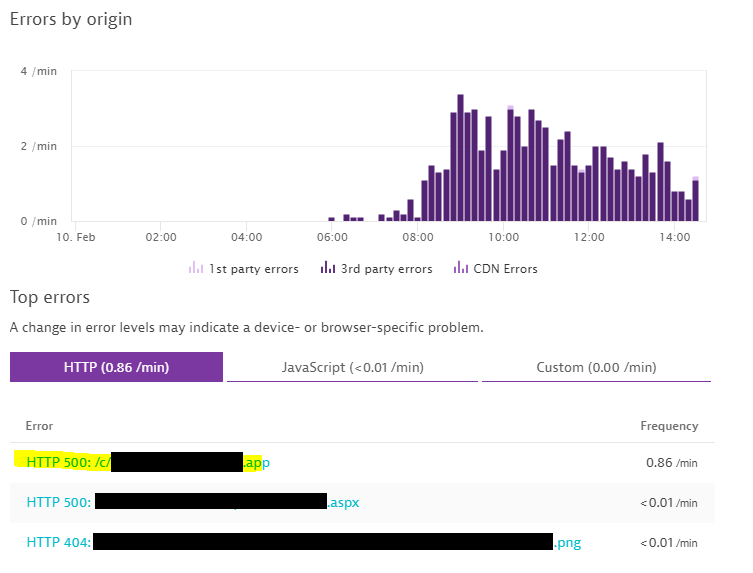
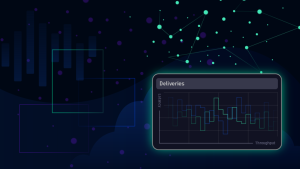
Two weeks ago, Dynatrace alerted on a dramatic increase in 3rd party HTTP errors on both external and internal facing users. The problematic 3rd part API endpoint in question in fact is managed by a different team within the same organization and is providing access to Salesforce lead data to different applications such as the self-service portal. Even though Dynatrace was not rolled out on the part of the infrastructure that is hosting this internal 3rd party API, Dynatrace is monitoring the usage, performance and behavior of this API through Dynatrace RUM! The following screenshot shows the spike in errors including the exact endpoint that started to throw HTTP 500.
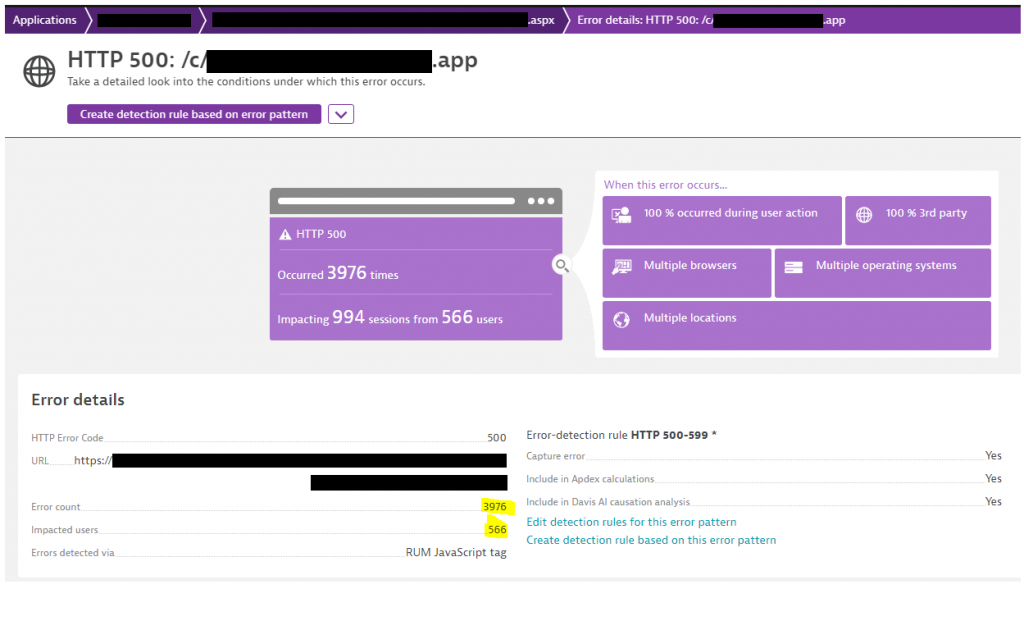
Besides alerting that this API endpoint had a significant jump in failed calls, Dynatrace also highlights the actual end-user impact for both internal and external users of that self-service portal. This information can be seen on the application specific infographics. The first showing that 566 individual internal users were impacted:
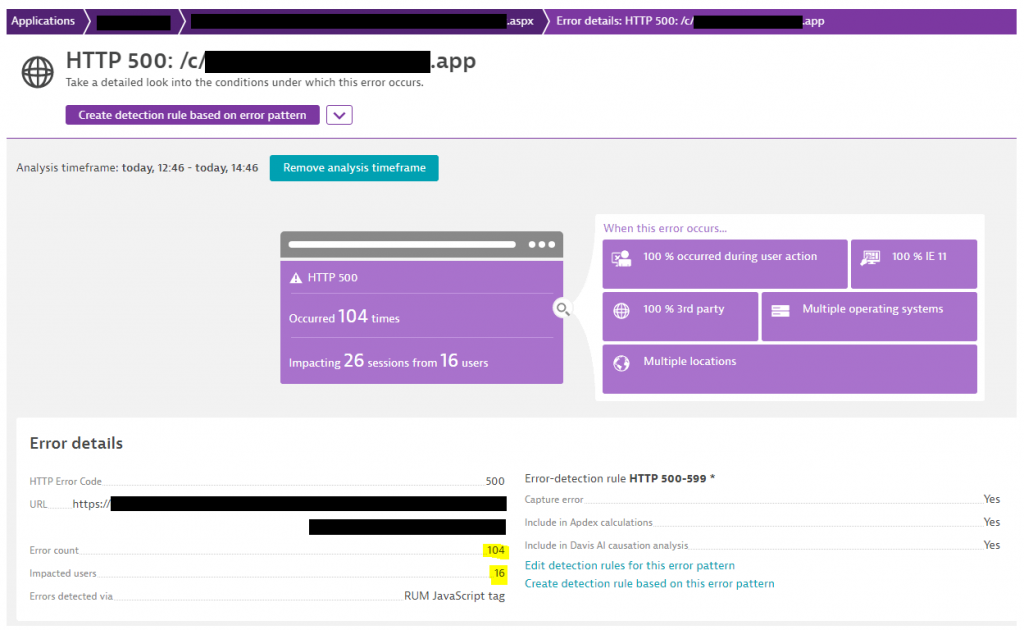
The data for the external facing portal shows that it only impacted 16 individual users.
Proactive alerting on otherwise blind spots
The great thing about this story is that without Dynatrace users would have started complaining about certain aspects of the self-service portal not working. This would have led to an increased number of support calls, slowed down the overall time it takes to execute these financial use cases, caused frustrations on many ends and would have eventually not solved the problem.
With the insights that Dynatrace gave them they could:
- Immediately pinpoint the problem to that internal 3rd party API and notify that team.
- Proactively inform their support team about the potential problem, and that the team is working on fixing it, ahead of any potential complaining users.
- Assess the overall impact of this problem based on the impacted user sessions.
The proactive alerting can also be automated by leveraging the Dynatrace Problem Notification Integrations, such as sending a message to Slack, Opening a Jira ticket or starting a ServiceNow or xMatters Workflow. For more of these integrations check out 3rd party Problem Notification Integrations.
Learn more about Dynatrace
As promised, below are some additional links to my YouTube tutorials I recorded with our Product Team. They are the best ones to explain how to leverage Dynatrace to ensure your systems and all depending elements are running as expected:
- Ensuring Digital Business Availability through Dynatrace Real User Monitoring
- Synthetic Private Browser Monitoring
- Mastering Dynatrace Synthetics: Getting Started and Advanced Concepts
Thanks again to Roman for sharing this story with me. Great to see that the capabilities our teams have been building into our Dynatrace Software Intelligence Platform really help our customers to Deliver Better Software Faster 😊

Looking for answers?
Start a new discussion or ask for help in our Q&A forum.
Go to forum