With Dynatrace, you can now monitor Windows hosts and Windows-based services like Active Directory or Microsoft Exchange with just a few clicks. You can gather all relevant data for continuous monitoring of your hosts and services with custom entities, metrics, and alerts without the need to install an agent. This speeds up and makes the configuration process of new hosts and services to be monitored more convenient than ever.
The newly released Dynatrace Extensions 2.0 framework enables you to push metric and event data easily and quickly to Dynatrace and use it in dashboards, alerts, and configurations. The range of automation features provided by the new extensions framework meets modern enterprise scalability requirements and allows Dynatrace to quickly address the monitoring needs of your environment.
We announced the new extensions framework a few months ago. We’re now very pleased to announce that we’re extending its capabilities with support for another protocol: Windows Management Instrumentation (WMI). WMI is the infrastructure for management data and operations on Windows-based operating systems. Extensions 2.0 utilizes the WMI protocol to unleash a broad set of capabilities to gain insights into Windows environments. The instrumentation can even be used to expose analytical data for all Windows-based applications.
The new remote Windows host monitoring extension provides:
- WMI Data Source configuration for OneAgent and agentless monitoring
- Topology definition and entity-extraction rules
- Dashboard templates
- Unified analysis
Agentless monitoring of Windows hosts
With the constantly growing range of Microsoft Windows systems and custom software exposing status information and analytical data via WMI, in order to make such information adjustable and reusable, customizable extensions are needed.
Typically, Dynatrace OneAgent is used to collect and provide all the data needed to monitor the health and performance of monitored hosts. For years, this has been highly valued by our users and recognized by Gartner, Forrester, ISG, and others. There are situations, however, when an internal company policy prevents any additional software, such as OneAgent, from being installed on a Windows host for compatibility, security, or legal reasons.
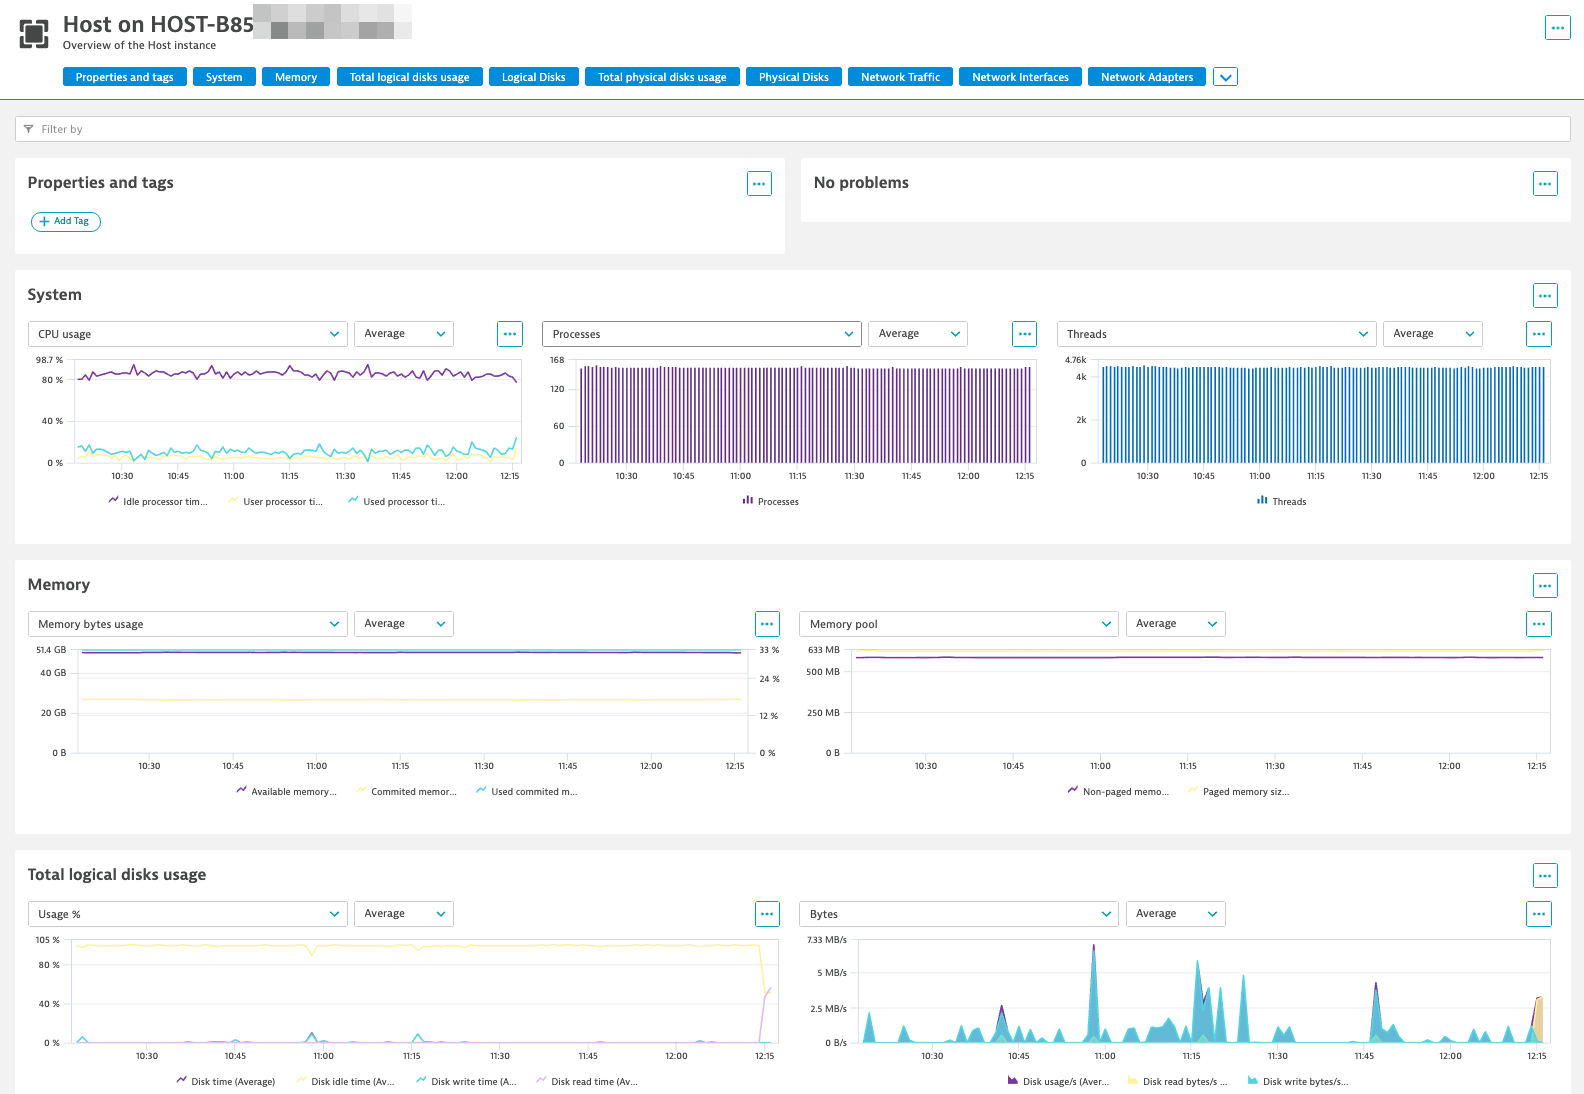
The newly released remote Windows host monitoring extension leverages WMI to collect data from Windows hosts, bypassing the need for any agent. This enables agentless, remote monitoring while providing the same transparency and visibility into Windows hosts that is available by installing OneAgent.
All monitored remote Windows hosts expose:
- CPU and memory utilization trends
- I/O operations and disk usage trends
- Network interface and traffic statistics
- Details of running processes and network service
This data can be used to monitor Windows Server 2003+ hosts and some older Windows XP hosts, such as ATMs.
Extend observability to all Windows-based applications
WMI also provides instrumentation for Windows-based applications. Application providers can use this to expose details about the performance and health of their applications. Most Microsoft tools, applications, and server software already use WMI to provide performance data and additional metrics.
This information can also be used in combination with OneAgent capabilities to extend visibility into services such as Active Directory services (DNS, DHCP, DFS) or Microsoft Exchange that run on monitored Windows hosts.
With their openness and flexibility, all extensions can easily be adopted to your specific requirements or even be transformed into new extensions, if necessary.
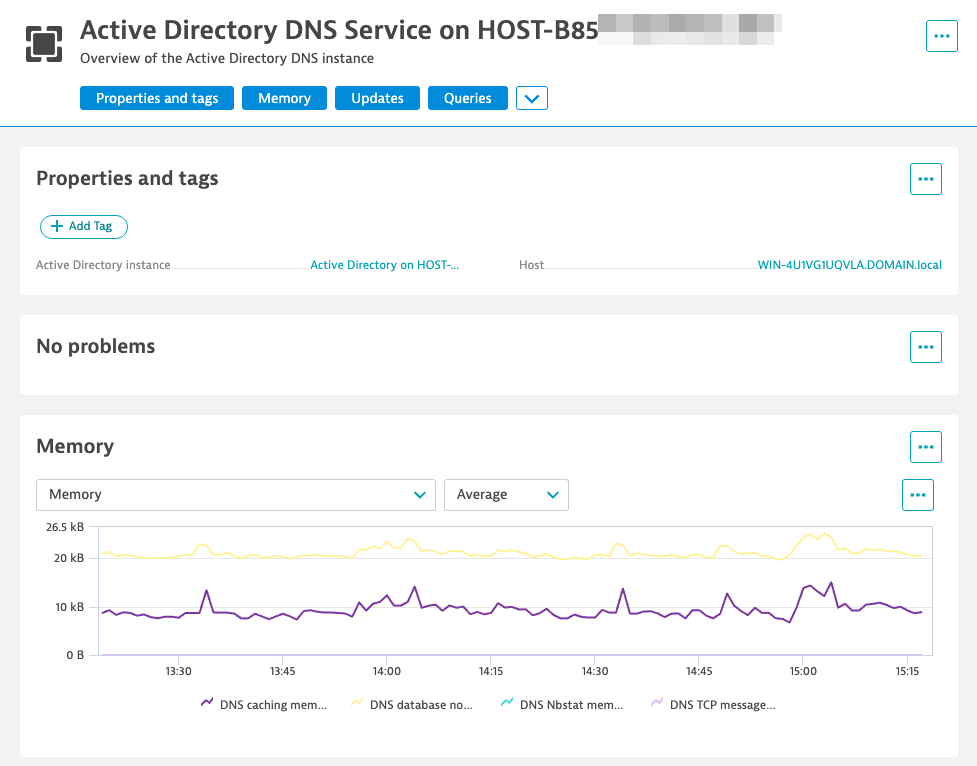
Additionally, potential security breaches can be identified by monitoring DNS and DHCP services running in the Active Directory domain. By adding more information from WMI events (coming soon), you’ll get all the details you need to diagnose and be alerted on the root causes of such breaches.
Domain expertise as a set of configurations in an extension
Our vision for the new extensions framework is to provide the most complete value in one package so that you have a solution for all your monitoring needs within a specific domain of expertise with the use of a single extension. All extensions introduced now contain multiple configurations applied during extension configuration via the Dynatrace Hub.
Data collection and metric metadata
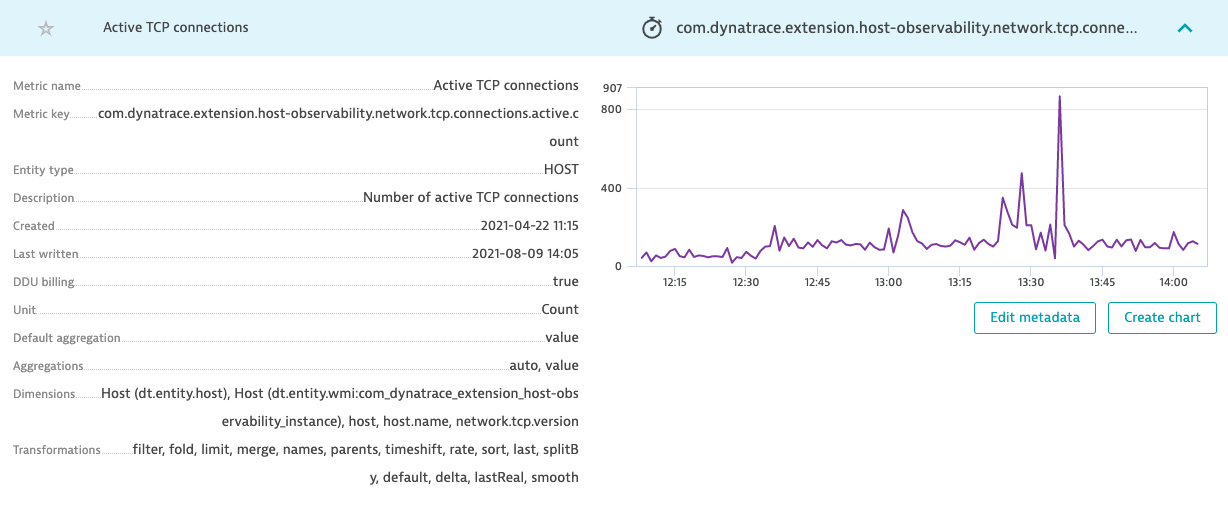
The new extensions collect all the details needed to flow metrics and their related dimensions into Dynatrace, allowing for further detailed analysis. In the case of WMI, queries and the transformation of their responses make data available as metrics within Dynatrace.
Additional attributes are gathered for each collected metric, making it easier to find them or explain their purpose.
Topology definition
Metrics alone aren’t enough; information about where metrics come from and how they fit into your environment make metrics understandable. The context of a metric often means as much as the metric value itself. As environments grow more complex, we see a great need to model and customize the topology-definition rules delivered out of the box. Declarative topology definitions allow Dynatrace to model any combination of entities and their relationships. Extensions can hold declarative topology definitions, making your topology more accessible and easier to understand.
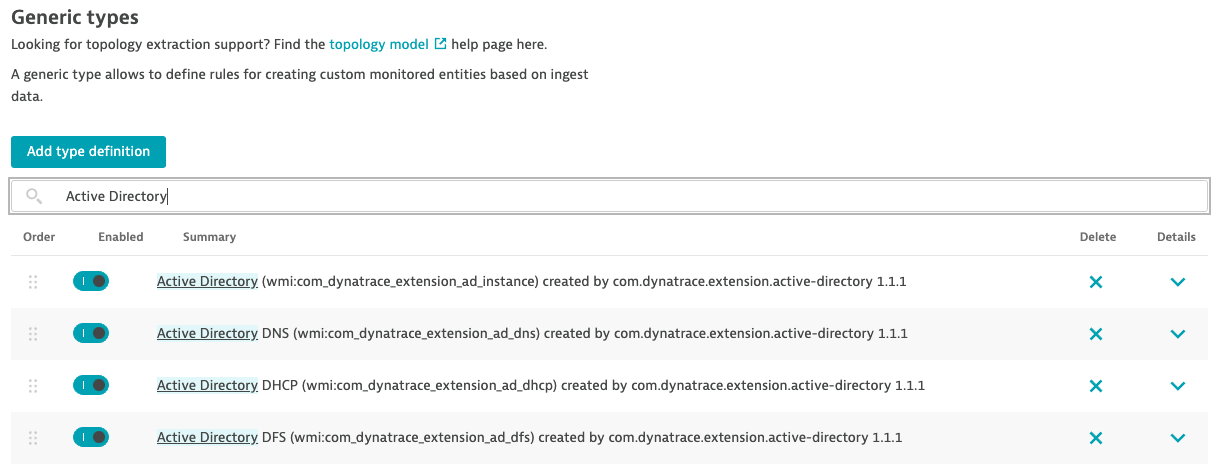
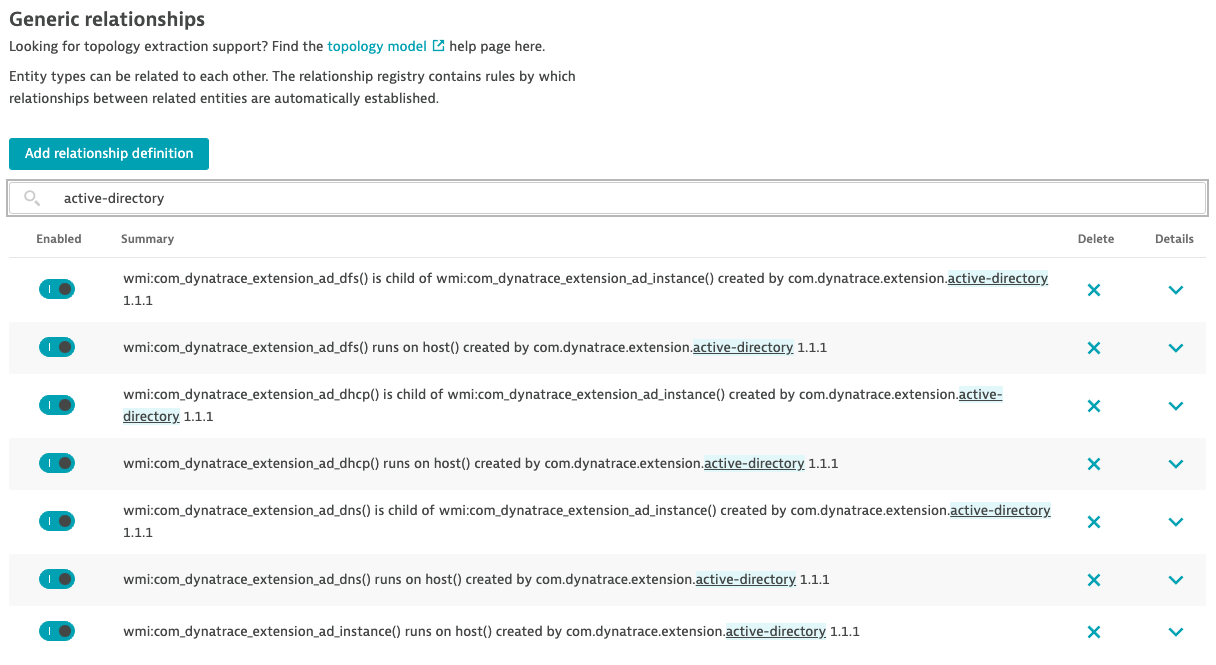
Not only does the topological model in Dynatrace make it easier to understand dependencies, it also allows the Davis AI causation engine to correlate reported events, making for more complete and focused problem detection, root cause analysis, and resolution.
Alerting rules
Dynatrace Davis AI makes the difference—metric anomalies can be either detected automatically or configured using a static threshold. A Dynatrace 2.0 extension supports both static as well as auto-detected baselines, whatever best fits your purposes, so that it’s dedicated to the specific technology supported.

Dashboards and analysis
Configurable dashboards are usually a starting point for proactive health checks or performance analysis. Dynatrace extensions provide custom-built dashboards so that you can start with a clear overview of the status of the monitored technology and then navigate further to get more details.
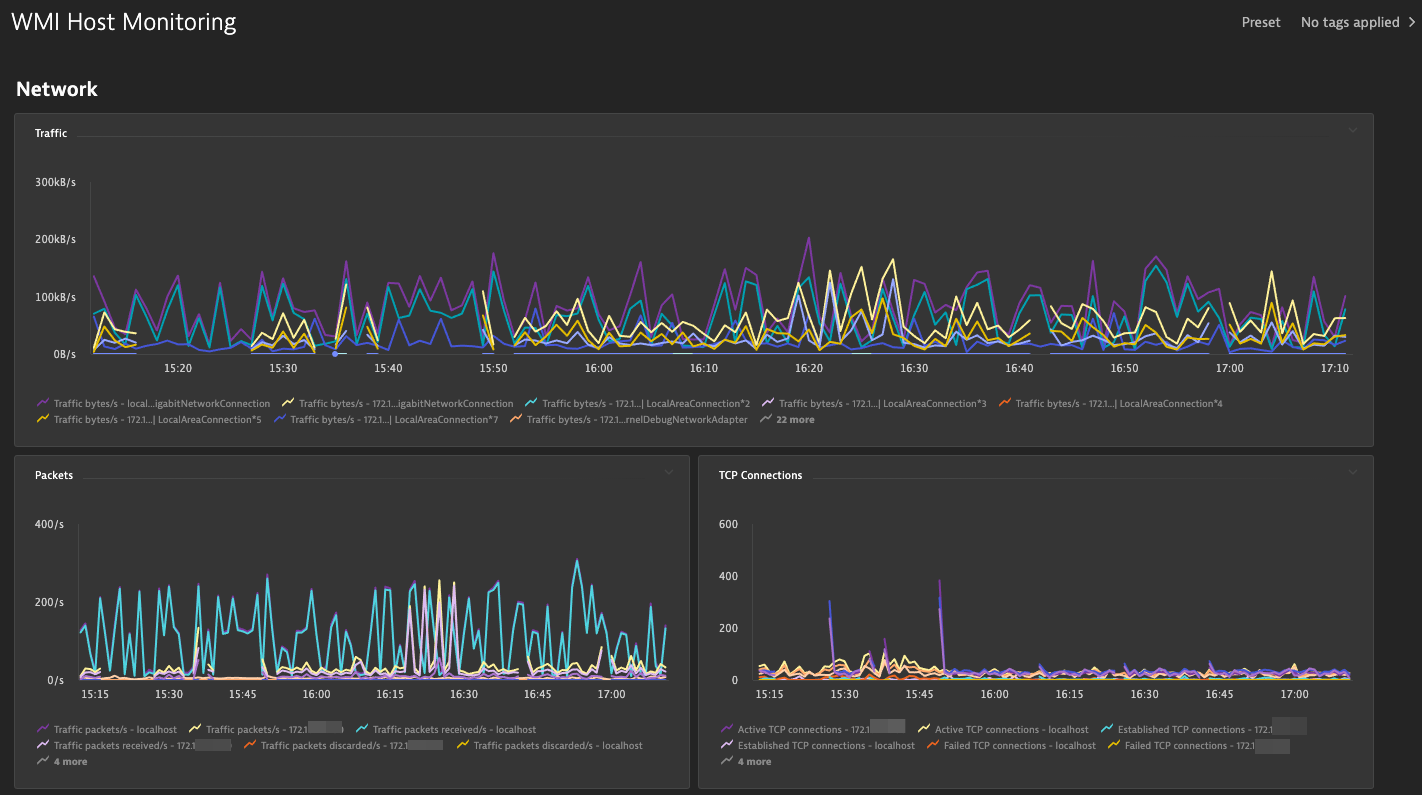
Unified analysis pages enable customization while providing a consistent look and feel across Dynatrace. You might have noticed from the screenshots above that the analysis pages for remote Windows hosts look very similar to other analysis pages in Dynatrace. These can now be adjusted to the specific needs of a monitored technology while, at the same time, they reduce the learning curve for new technologies, thanks to our unified approach to analysis pages. The transition to unified analysis has just begun and will continue to be delivered in phases. Based on your feedback and our research, you can expect to see more unifications and usability improvements.
What’s next
We’ll have more for you on the WMI monitoring extension in particular and the extensions framework as a whole. Look out for our announcements regarding:
- Windows event reporting
- Integrating Log Monitoring with extensions
- Tool to support extension development process
- Additional protocols, enabling support for an even broader set of technologies within the extensions framework.
We want to hear from you
Some of the solutions described here are new, others are built on concepts we’ve introduced earlier. We rely on our community of users and partners and listen closely to all suggestions and feedback. Please let us know what you think of our innovations, if you’d like to share a virtual coffee with us, if you expect more, or if you would prefer to handle product feedback in a different way.



Looking for answers?
Start a new discussion or ask for help in our Q&A forum.
Go to forum