
Only when you have an accurate picture of how your end users experience your applications can you take necessary action to boost the success of your business. For example, as a business owner, you might want to view your conversion goals in context with your application’s error rates. As a product owner, you might be interested to know how your latest release performs in a geographical region where your company has just started doing business.
A few months ago, we released user session queries to enable you to dive deep into your customers’ user session data. Today, we’re happy to announce that this powerful feature has been enhanced with data exploration and visualization capabilities. Now you can:
- Get answers to your most burning questions about your end users’ experience
- Easily compare and view trends on multiple metrics with the new visualization
- Compare trends across two timeframes with the new, easy-to-use timeframe selector
Get answers to your most burning questions about your end users’ experience
With these improvements in user session queries, you get immediate answers to questions such as:
- Do our customers leave our website because of slow third-party content, such as social sharing buttons?
Third-party content can include ads, analytics, widgets, and other scripts. They can make your website more dynamic, but they can also make it slower. Third-party content can have a huge impact on how long your customers stay on your site.
With user session queries, you can easily identify such bottlenecks and quickly take action to improve user experience.
- How many users visited our website last weekend from the region where we just launched a new campaign?
When you launch a new marketing campaign in a specific region, you probably want to know how your users are reacting to it.
You can use user session queries to see the current number of visits to your website as well as how this number has changed since a new release or campaign in a specific region.
- Did our premium customers shop more in the last 24 hours due to the new campaign?
Sometimes you might want to focus on a specific user segment such as your premium customers. How did these customers react to your new campaign?
You can now see if the average shopping cart value has increased or decreased since the previous week.
- How many website errors do we have? Are the errors frustrating our customers?
Website errors create uncertainty about your company in the minds of your customers. Your customers might click the Back button and go somewhere else, possibly to one of your competitors that provides inferior service but an error-free website.
With user session queries, you can see exactly when your customers expressed frustration in the form of rage clicks (repeated clicks on a non-functioning button or screen region). You can then easily identify the errors that caused the frustration.
- How does the customers’ browser version impact the speed of our website?
Older browser versions can be less stable and more vulnerable to security issues. Therefore, they might limit your website’s potential, and ultimately, your business.
Use user session queries to see how your website content is loading and how this is affected by the browser version.
- How do our customers experience our website since our recent release?
Find out if the number of usability issues increased or decreased since a major deployment and if your end users’ experience has changed for better or for worse.
Easily compare and view trends across multiple metrics
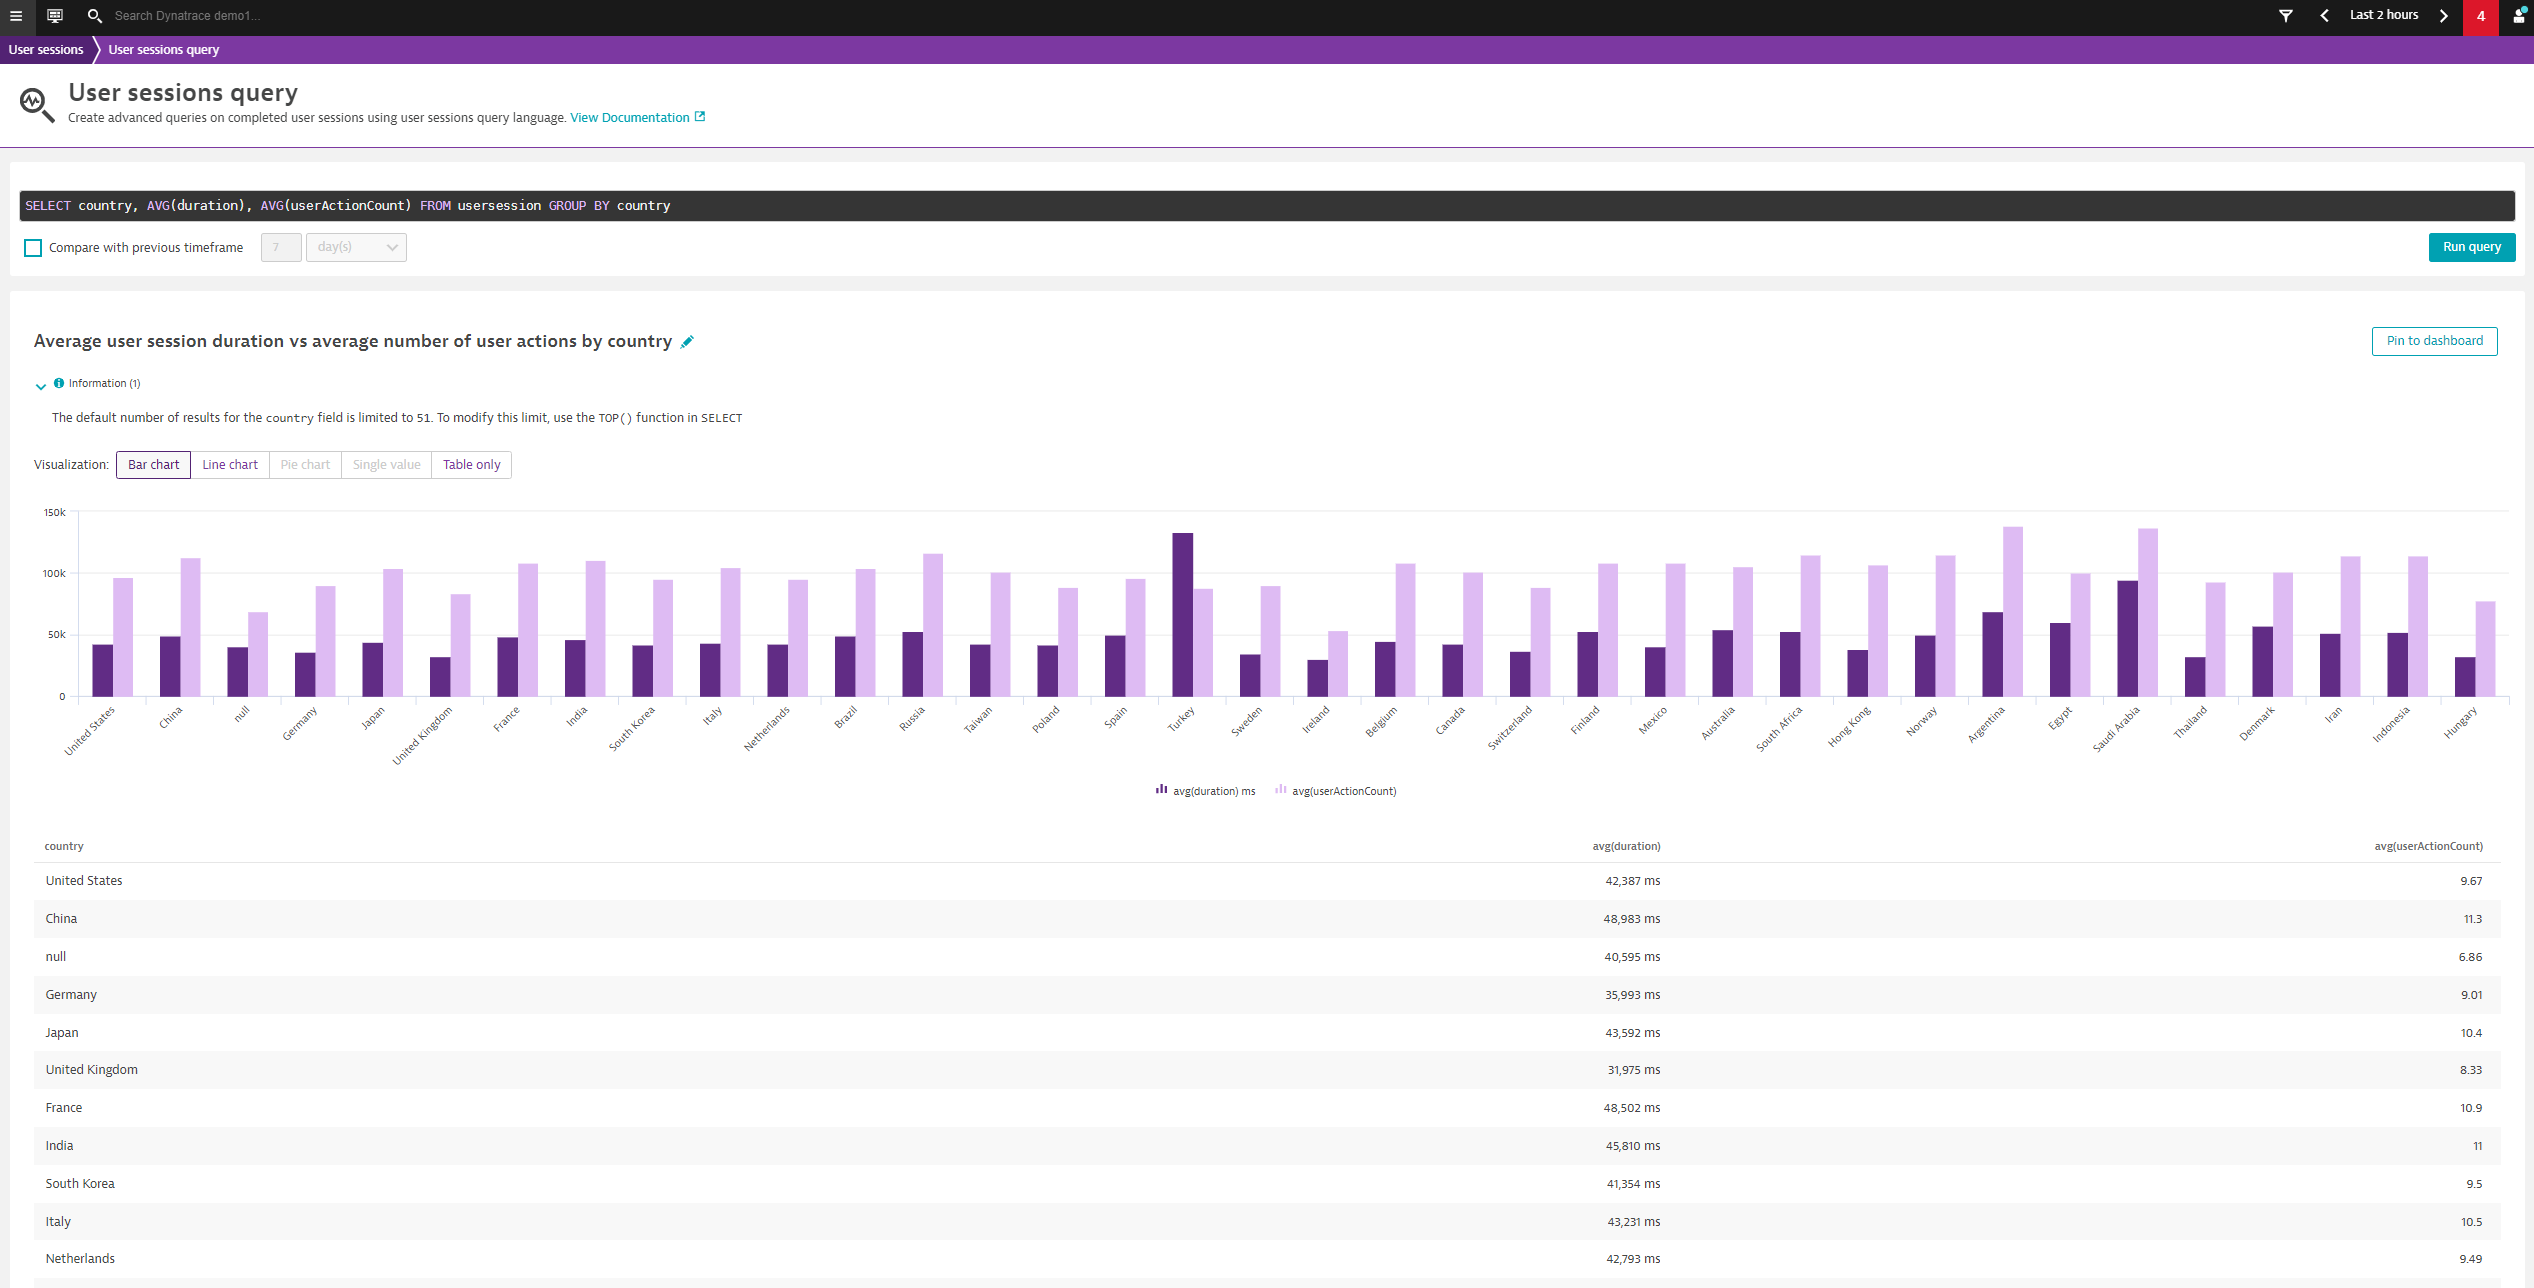
With the newly enhanced user sessions queries, you can query and display multiple metrics side-by-side in a bar or line chart. Charts reveal the highs and lows at a glance, so you can easily see how the different metrics affect each other. For example, you can see how the average user session duration relates to the average user action number by country.
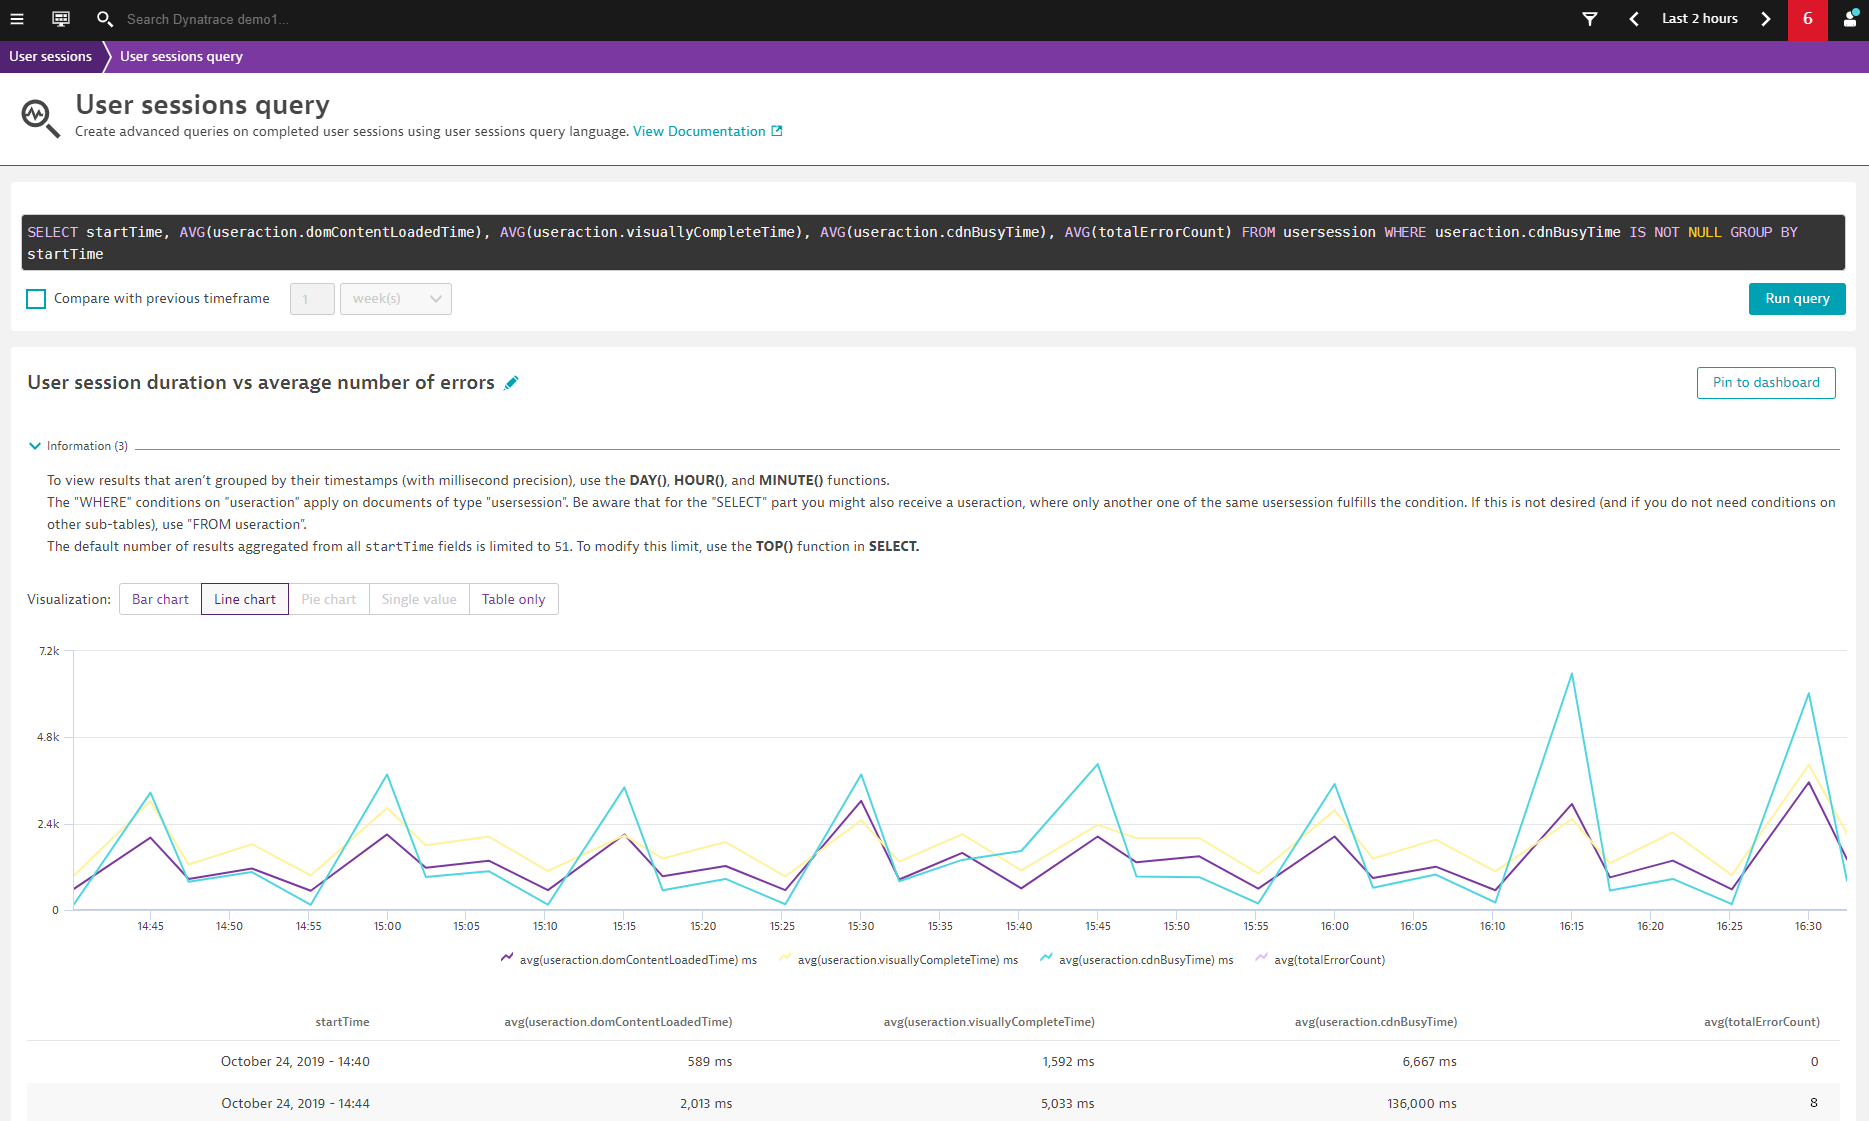
Or consider this example: you want to see how the average number of errors affects the amount of time your users spend on your website. With our enhanced visualization, you can easily chart such metrics side-by-side, even when they’re measured in different units and there are significant differences in the values.
Compare trends across two timeframes with the new easy-to-use timeframe selector
You might want to compare different timeframes to see how your user session information has evolved over time. Until now, the global timeframe selector has been your only option for doing this. To give this functionality a boost, we’ve now added an easy-to-use timeframe selector directly on the User sessions query page.
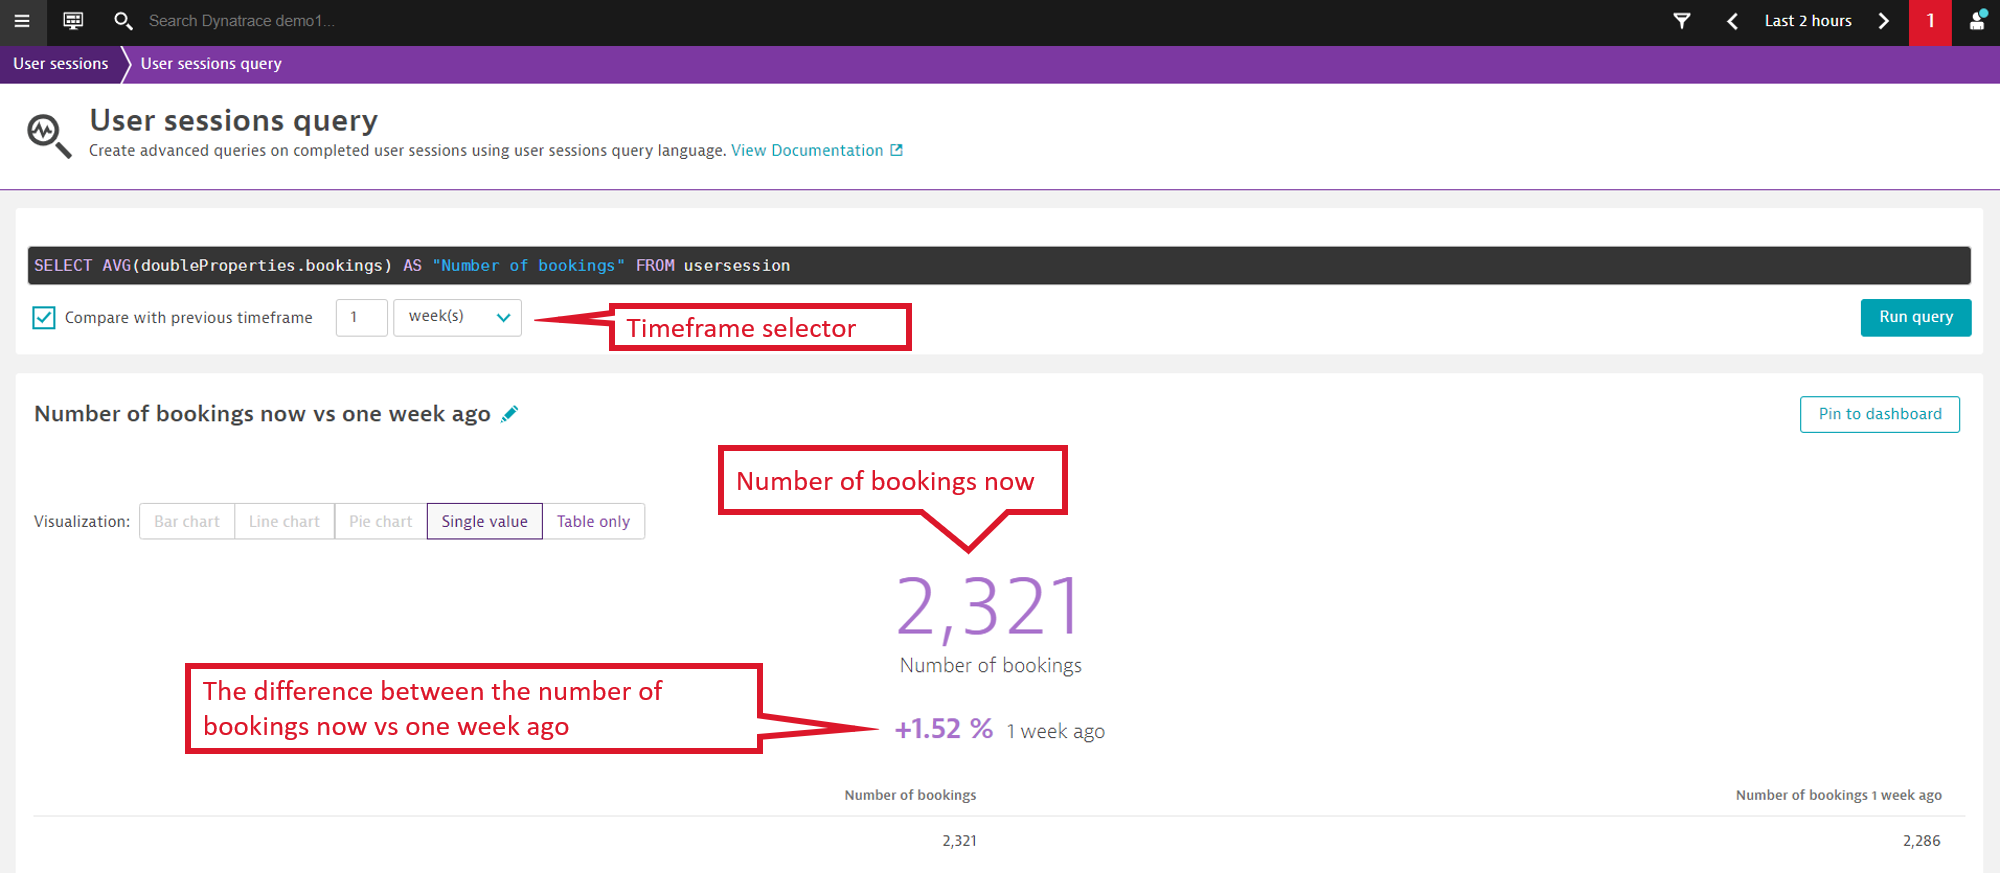
With the new timeframe selector, you can select two timeframes to see how the user session information compares between two different points in time. For example, you might want to compare data from today, Friday, from 8:00 AM to 10:00 PM, to the data obtained between 8:00 AM to 10:00 PM last Friday, which happened to be Black Friday, one of your busiest days of the year.
The timeframe selector allows you to select a numeric value along with time units such as hours, days, or weeks.
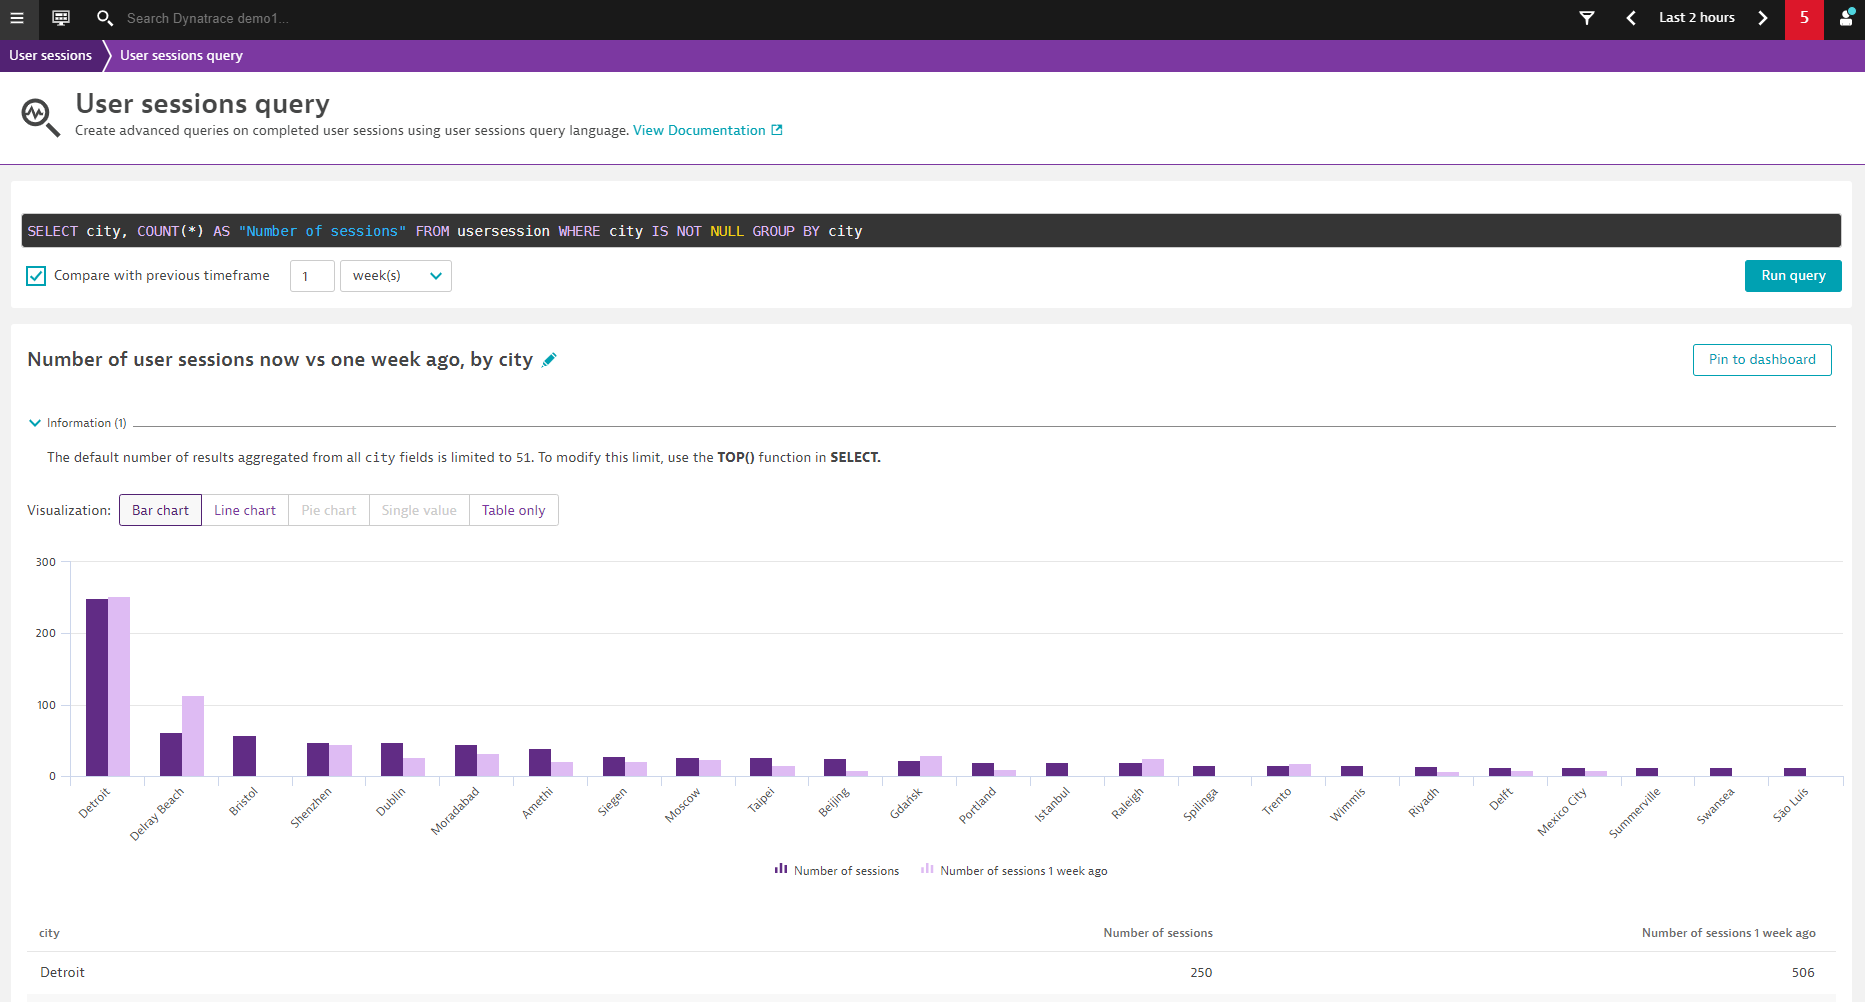
Here too, you can use charts to visualize data comparisons between two timeframes. In the screenshot below, you can see how the number of user sessions on your website has changed as compared to a week ago, grouped by city.
With some simple dashboarding techniques, you can easily pin your frequently viewed charts and visualizations to your dashboards so that, at a glance, you can see all the metrics and KPIs that are critical to the success of your business.
Dynatrace user sessions queries will change the way you look at your data. Powerful queries coupled with functionalities for segmenting, aggregating, and filtering data guarantee that you can fetch the exact information you’re looking for in just a few minutes. The vast and sleek array of graphs and charts makes it easy to present your findings to your colleagues.
Are you as excited as we are?
We bet you are! The enhancements to user sessions queries are available with the release of Dynatrace version 1.178. They’re available for all users by default. So have fun and let us know what you think of them!
It doesn’t stop here!
We’re now in the process of developing brand new functionality for user sessions queries, including new visualizations that will enhance how you look at your data. Stay tuned!


Looking for answers?
Start a new discussion or ask for help in our Q&A forum.
Go to forum