
In today’s complex IT environments, the sheer volume of data created makes it impossible for humans to monitor, comprehend, or troubleshoot problems before they impact the experience of your end users.
Dynatrace Davis® AI has proven over the past four years that a fully automated approach to problem analysis is the only valid approach—especially in highly dynamic, web-scale cloud environments where manual root cause analysis is impossible. Davis automatically analyzes and alerts on many important anomalies that can occur within your IT environment, such as host, process or service outages.
Still, you might have use cases that rely on important custom data streams. For example, you might be using:
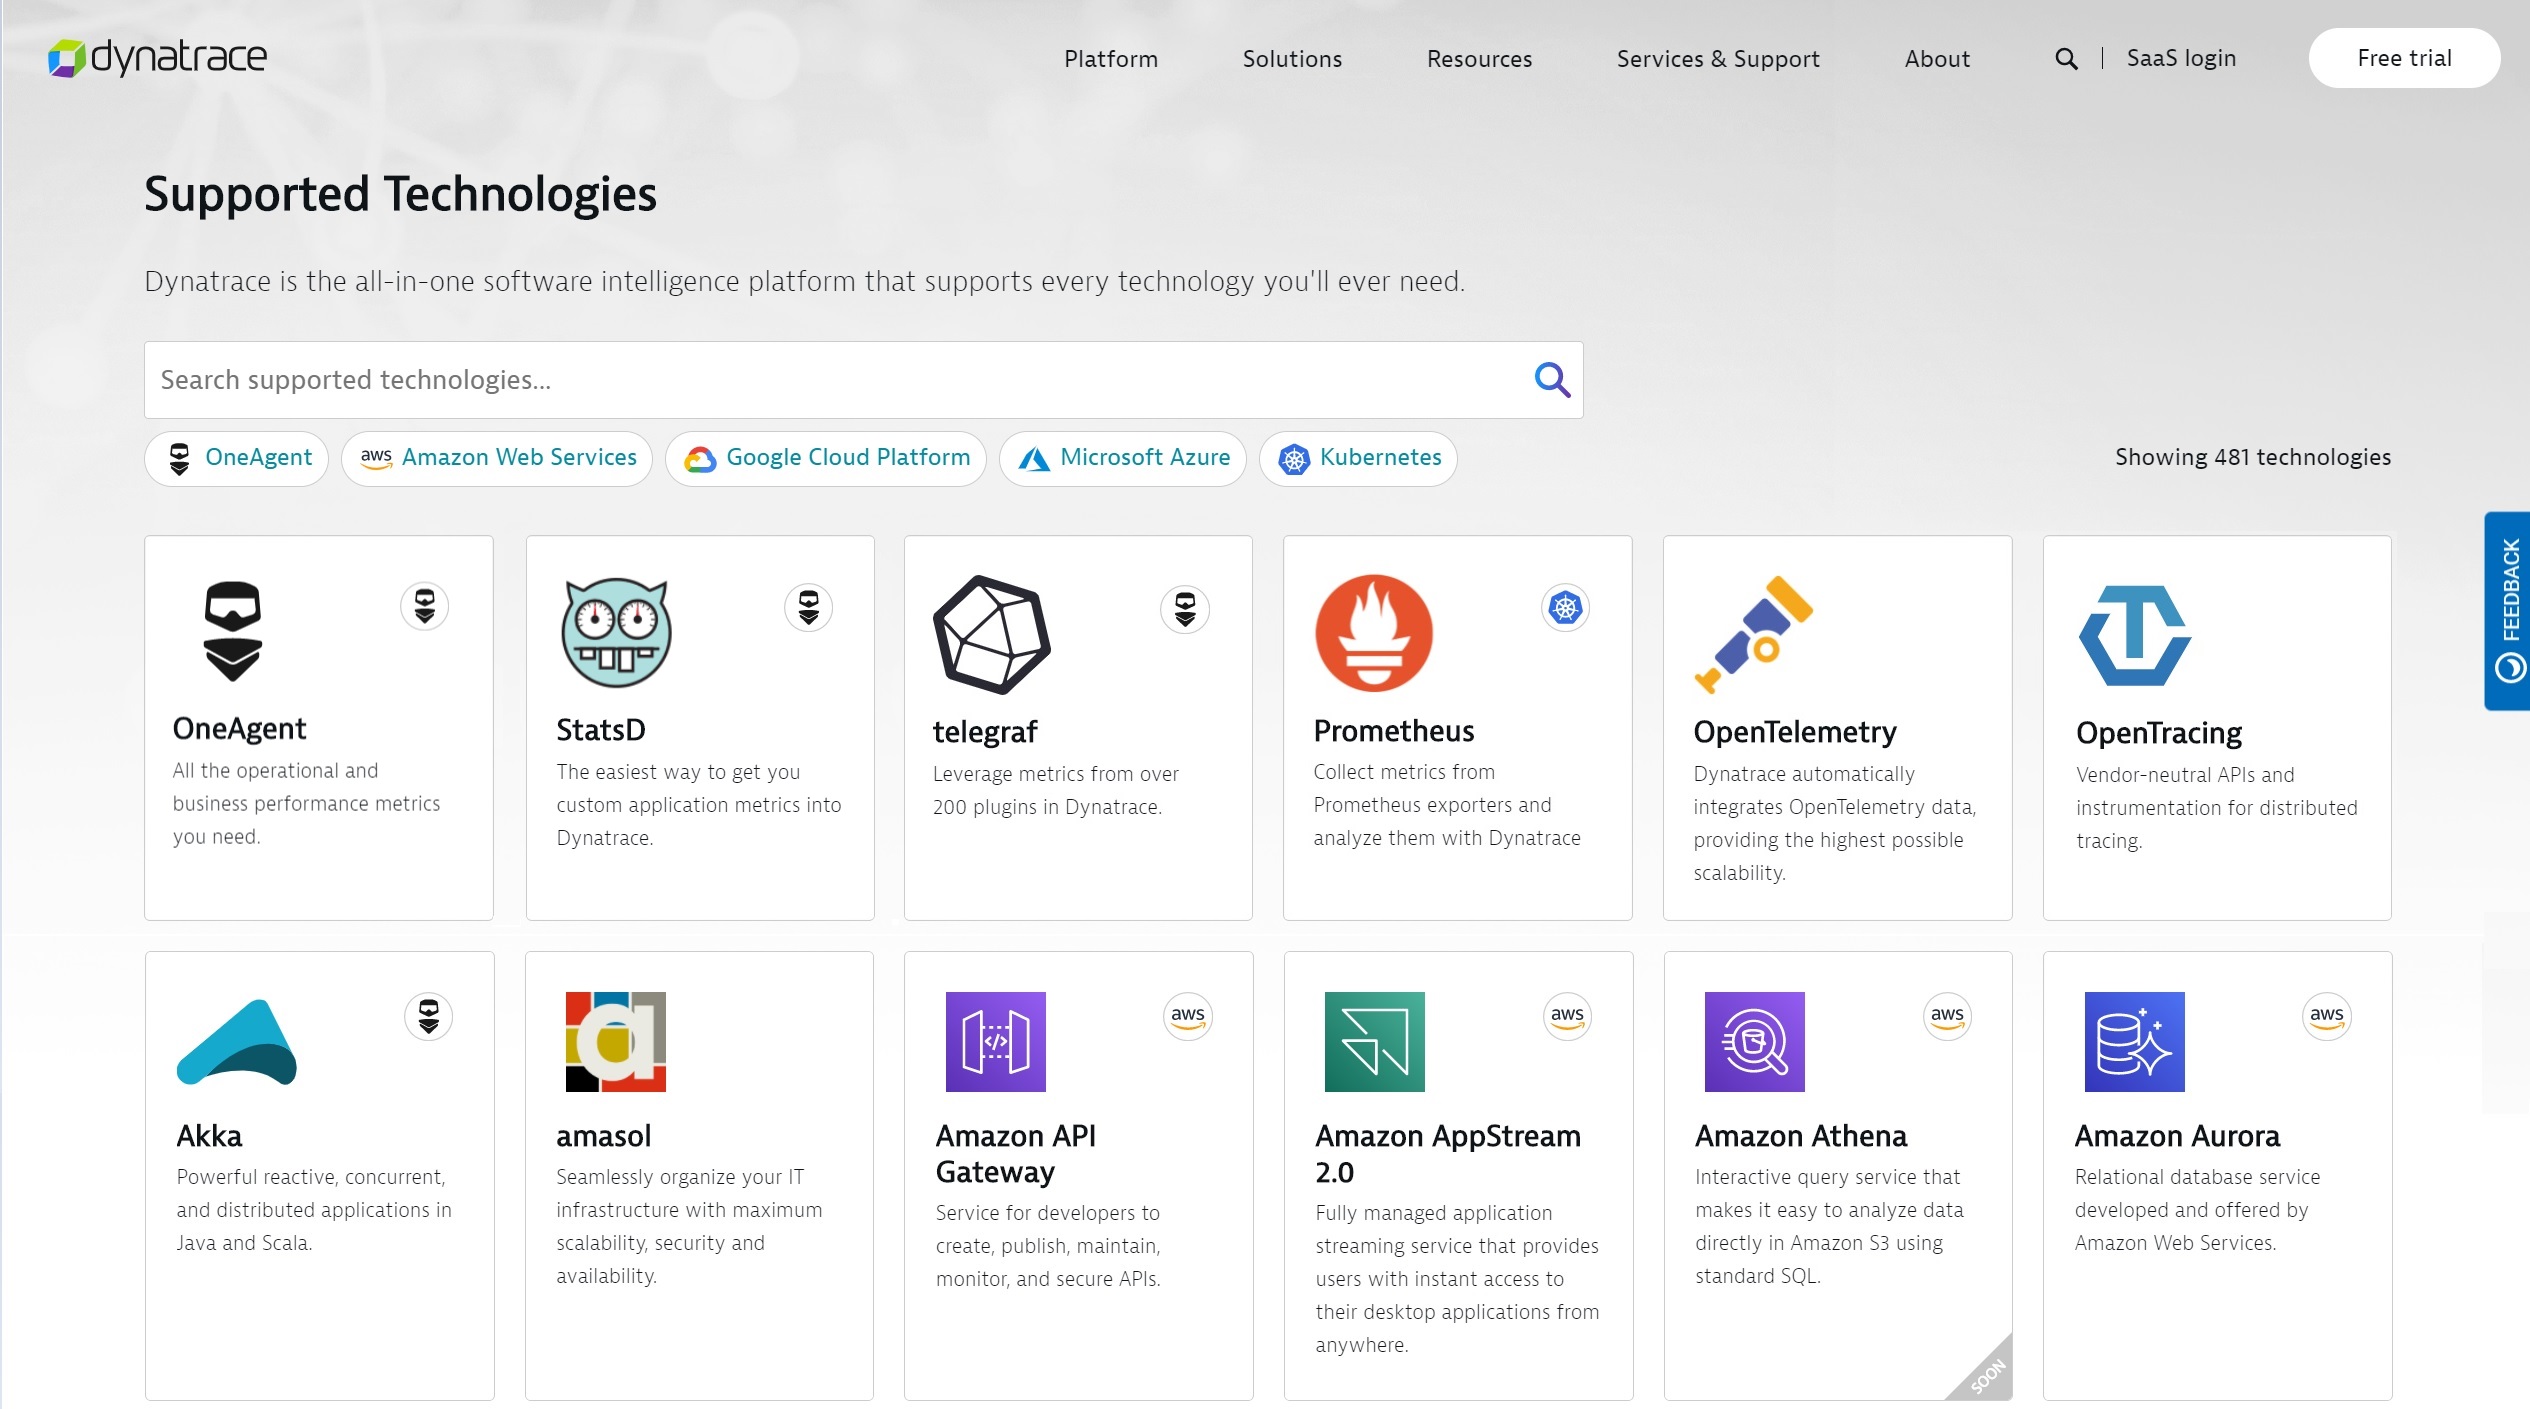
- any of the 60+ StatsD compliant client libraries to send metrics from various programming languages directly to Dynatrace;
- any of the 200+ Telegraf plugins to gather metrics from different areas of your environment;
- Prometheus, as the dominant metric provider and sink in your Kubernetes space.
But how can you ensure that these data sources are always up and running? How can you ensure that the measurements are always available and healthy?
In order to detect all kinds of availability issues, you need AI-powered alerting for your third-party data sources, too.
Let the Davis AI automatically detect outages within your custom data streams
Recently, we simplified StatsD, Telegraf, and Prometheus observability by allowing you to capture and analyze all your custom metrics. By automatically feeding these captured metrics into our Smartscape topology model and Davis AI, Dynatrace eliminates the need for manual maintenance of hundreds of alerts, thanks to our trusted auto-adaptive baseline engine.
Now you can:
- Alert on the outage of a custom data source
Alert whenever your custom data source stops sending measurements for whatever reason. While Dynatrace OneAgent has resilience, built-in health checks, and reports automatically on unavailability, your custom data sources will not offer the same self-monitoring capability.
- Alert on expected but missing measurements
This use case might sound similar the first one, but it solves a completely different purpose. Here the data source is up and running but you’re not receiving the expected measurements. Say, for example, that you expect the count of executed batch jobs to be sent every 10 minutes, but you haven’t received a count during the last 30 minutes. As this is suspicious, you need Davis to report on the situation.
- Alert on unhealthy metric states and missing data
This use case is a combination of the first two, along with alerting on low or high levels of the expected measurements. An example here is if you report the CPU usage of a SNMP network device through your Telegraf agent, and you want to receive an alert whenever the CPU usage reaches a critical level or finally when the device is gone, but no measurements are coming. So, this alert is a combination of unhealthy metric state together with missing measurements.
Now let’s see how you can detect and alert on those use cases listed above within your own Dynatrace environments.
Easily alert on the outage of a custom data stream
Let’s assume that you are using our convenient metric ingest protocol through the OneAgent ingest channel, or through the Dynatrace REST API. The metric source in this case is either a third-party agent such as Telegraf or your own script written in any of your favorite languages.
In this example, we send measurements from a Synology NAS to a Dynatrace monitoring environment to check the health and activity of the network disk.
For this purpose, we embed a Telegraf agent into a Docker container and run it directly on Synology NAS to continuously report selected SNMP measurements. As Synology offers an integrated Docker runtime within their network disks, it doesn’t take much effort to turn the network disk into a custom data source for Dynatrace.
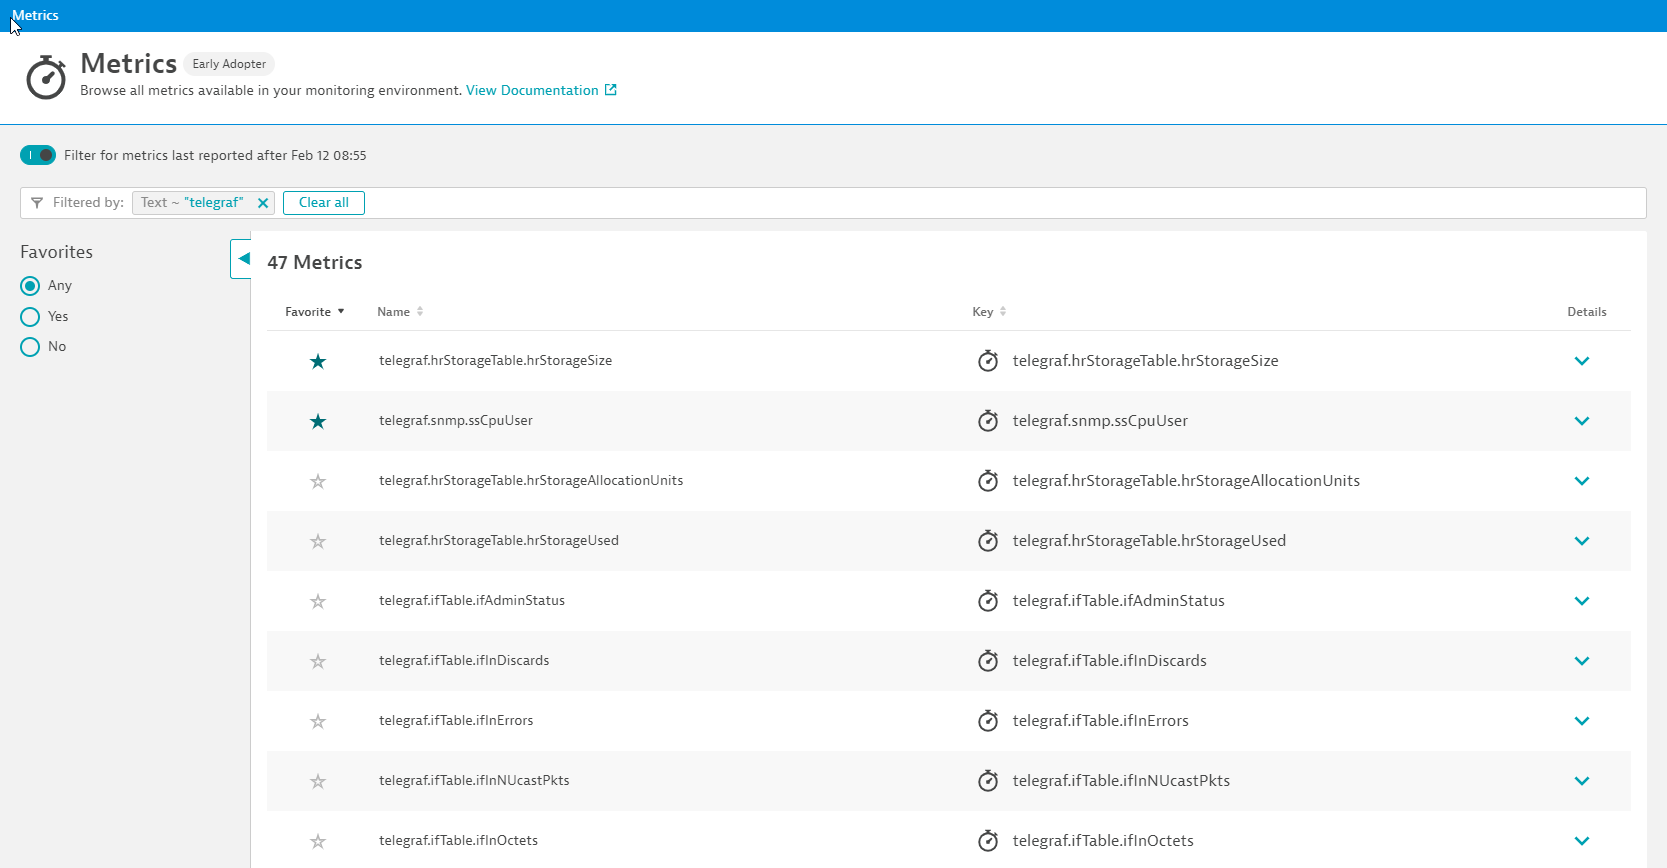
The screenshot below shows the Dynatrace Metrics browser, filtered by the metrics that the Synology custom data source reports:
Charting the ssCpuUser metric shows that a reliable and continuous stream of measurements is sent directly by the Synology network device, as shown below:
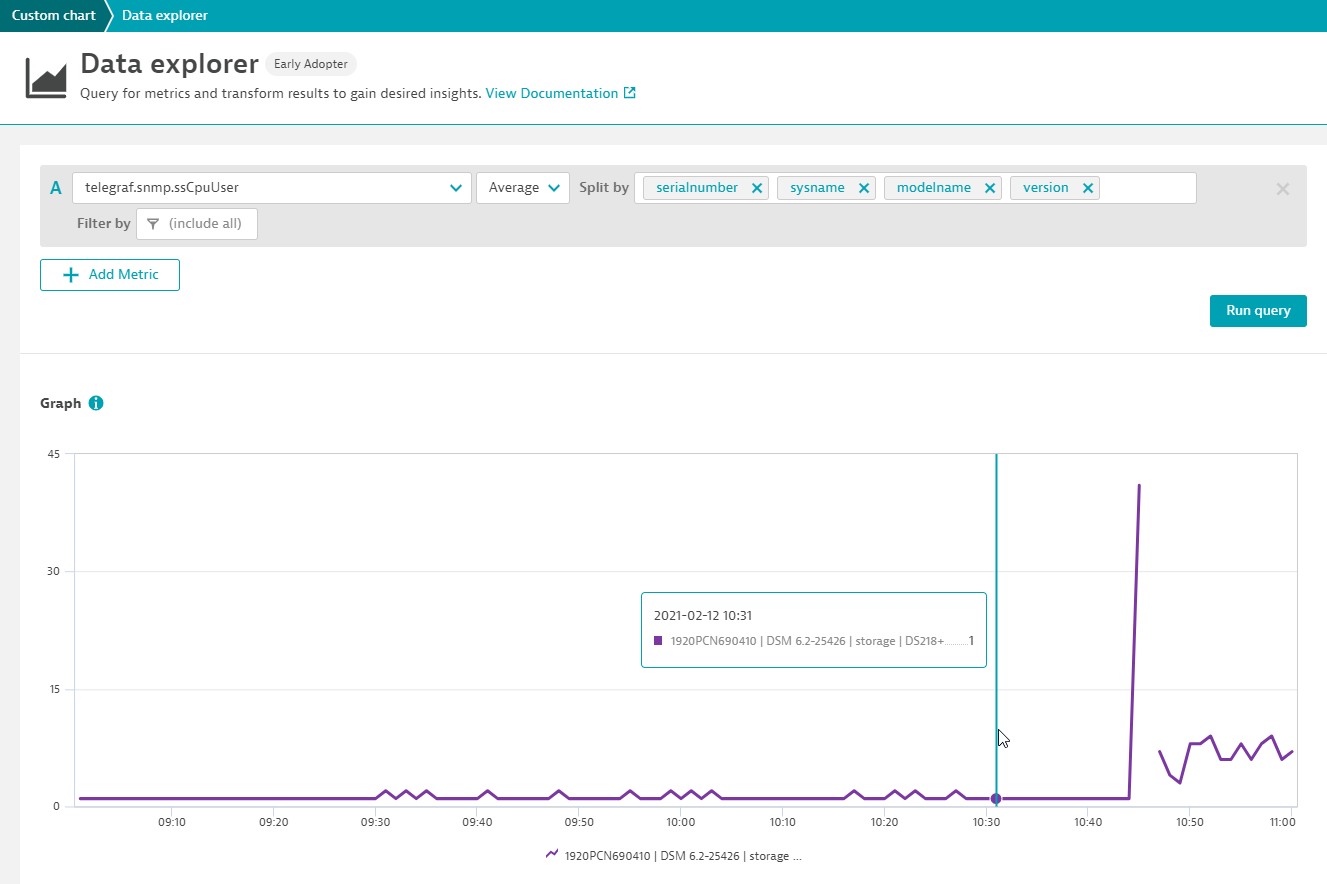
The alert on an outage of the data source of course relies on a reliable continuous data stream, as you simply can’t alert on a data source that reports measurements in a sparse and unregular manner.
As our data source is expected to report back measurements to Dynatrace every 10 seconds, it is the perfect source for alerting on outages.
To detect an outage of the Synology disk, navigate to Settings > Anomaly detection > Custom events for alerting. Then create a new alerting config and select your own metric as input, as we’ve done for the Synology CPU metric below:
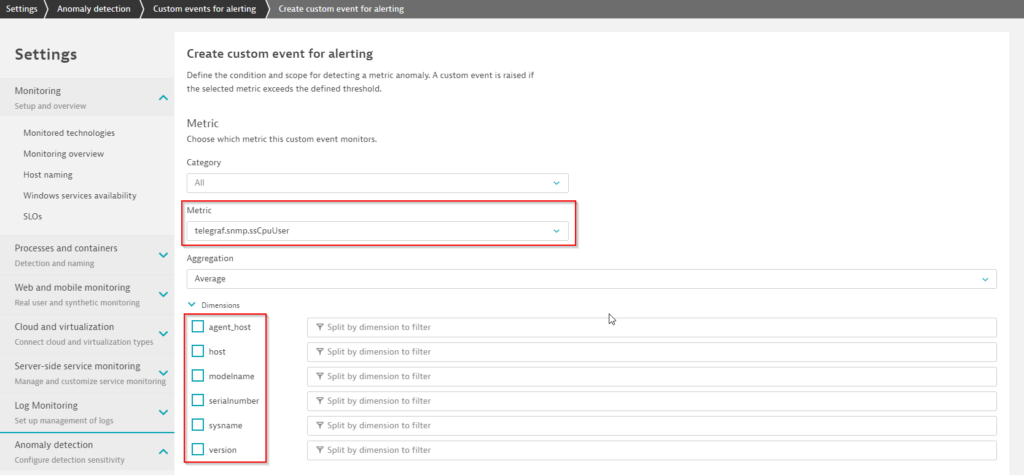
Here, the individual metric dimensions that can be used to filter the alerting to a specific measurement are also shown. For example, if you monitor 100 Synology NAS devices, the serial number dimension will show 100 different numbers, one for each of your devices.
Mind that without a filter, you will alert on all one hundred NAS devices, so use the filter to reduce the alerting scope of your configuration.
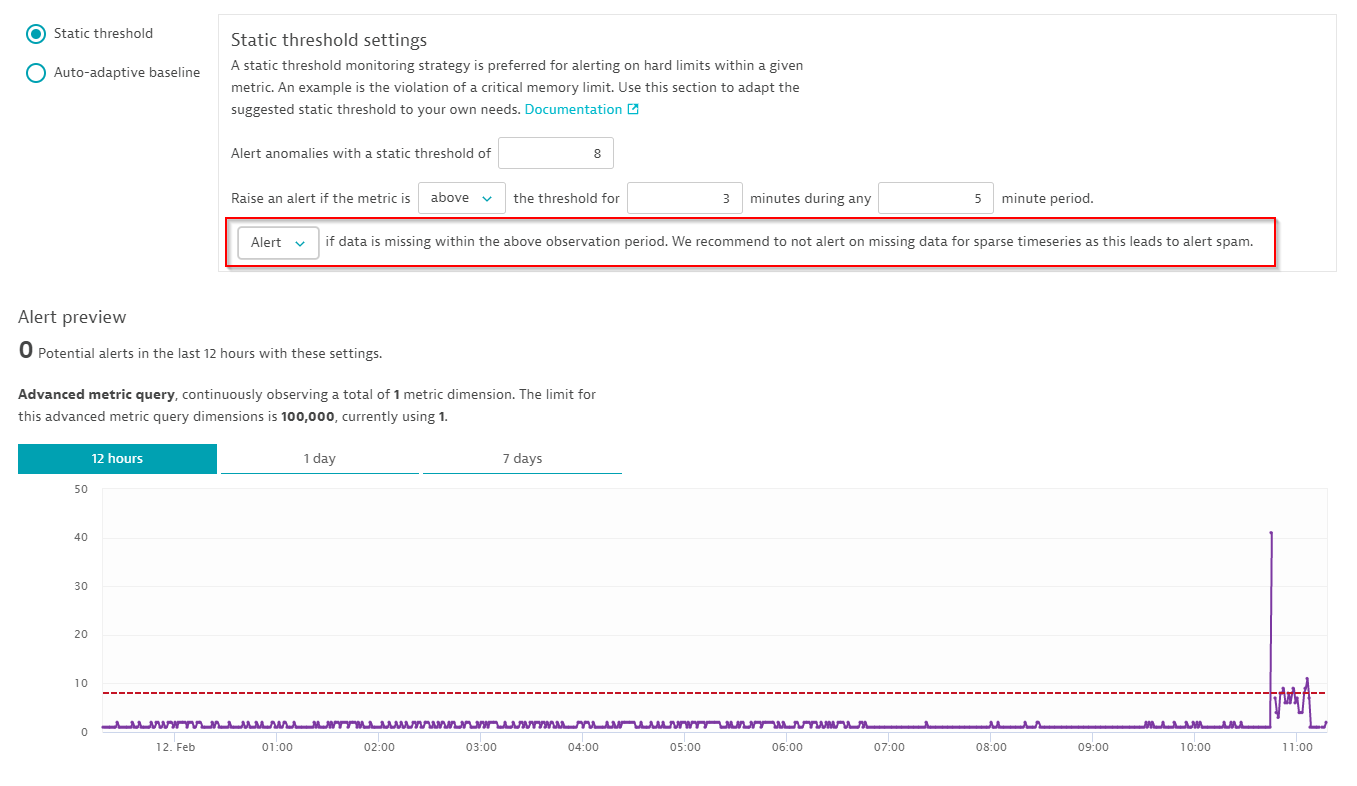
The next step is to enable the new Alert if data is missing…. option within the individual monitoring settings. Davis automatically suggests a reasonable CPU threshold value for your device along with an observation period of 3 out of 5 minutes, as shown below:
Define your alert message
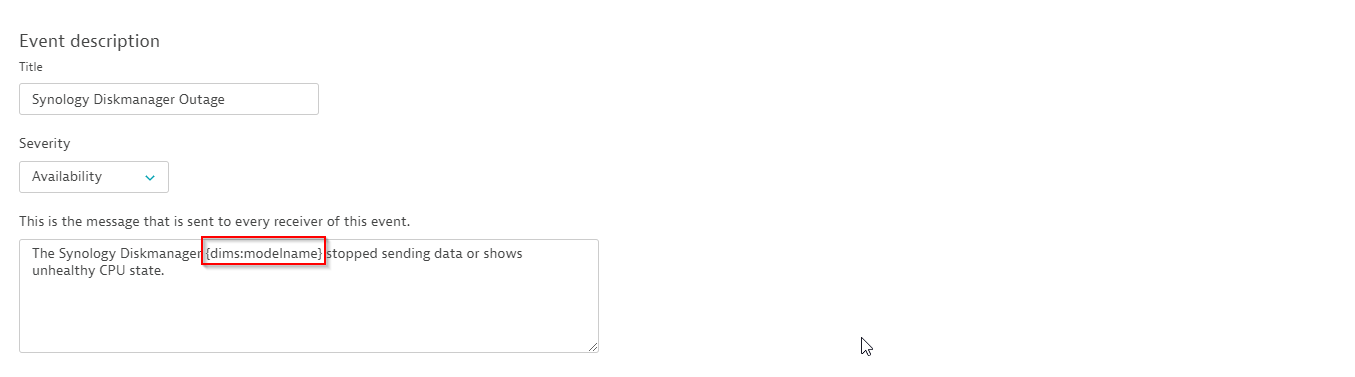
The final step in the configuration is to define the text message and event description that will be sent whenever the Synology NAS stops sending data.
As shown below, we’ve defined the event name to be Synology NAS outage, along with a Davis severity level of Availability and added the violating Synology model name in the event description:
Use dimension placeholders to customize alert messages
Another newly introduced feature is the selection of a metric dimension within the alert message. In our example, we’ll use the {dims:modelname} placeholder because it contains the human readable name of our Synology disk.
Whenever one of the Synology NAS devices experiences an outage, its name will show up automatically in the alert message.
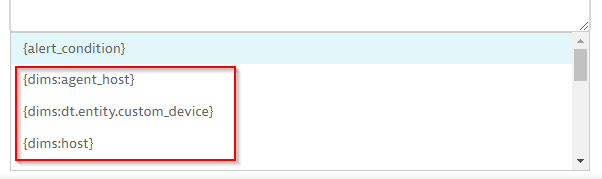
In general, the placeholder suggestion proposes all the available metric dimensions, where you can select the most important ones for your alert message.
In case you would like to get the full set of metric dimensions of the violating measurement, you have to use the unfiltered {dims} placeholder.
See the possible placeholders for the Synology example below:
Limits safeguard the health of your monitoring infrastructure
Within your Dynatrace environment there are specific limits in terms of possible alerting configurations that help to safeguard the health of your monitoring infrastructure.
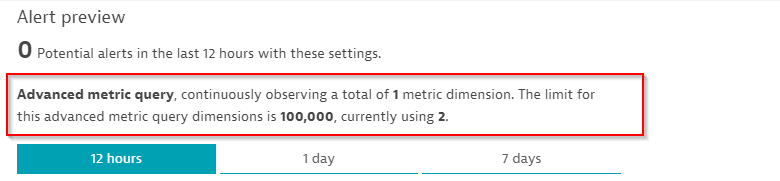
We classify metric alerting into what we call Basic metric queries, where the number of actively monitored metric dimensions is not limited and Advanced metric queries, where we must apply a technical limit of 100,000 dimensions per environment.
Most of the simple metric threshold models are under the category of basic metric queries, as their query overhead is negligible.
Whenever you switch to Alert on missing data, you’re switching from a basic metric query to an advanced metric query as Dynatrace has to actively check for the existence of data in each minute.
You see the query category in the preview, along with the used quota within your environment, as shown here:
Last step: Testing the outage incident
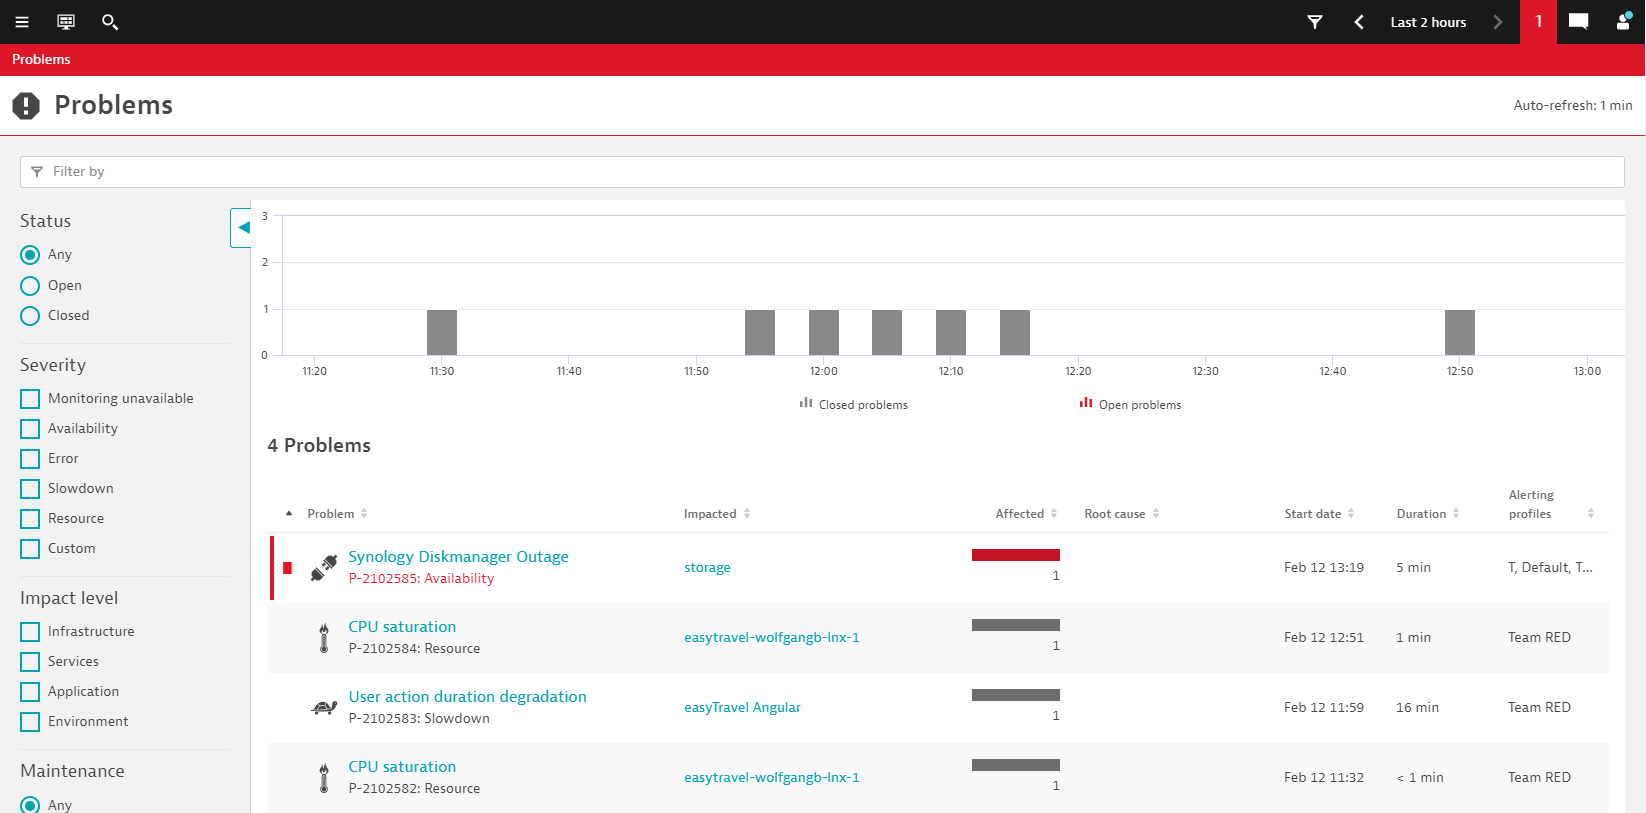
Finally, now that we’ve configured the outage detection for Synology NAS, we can turn off the SNMP monitoring and the appropriate outage report shows up in Dynatrace, as you can see here:
Summary
Opening the Dynatrace Software Intelligence platform for all kinds of third-party data ingest has opened the door for interesting use-cases, such as the monitoring of network devices or the reporting of custom metrics.
By giving Davis the capability to actively detect the outage of third-party data sources, such as Telegraf, StatsD or SNMP, and to report on missing but expected data, your Dynatrace environment becomes even more powerful in terms of detecting all kinds of availability issues.
Seeing is believing
New to Dynatrace? Try it out by starting your free trial today.


Looking for answers?
Start a new discussion or ask for help in our Q&A forum.
Go to forum