
In this article, we will discuss how to read the SQL Server execution plan (query plan) with all aspects through an example, so we will gain some practical experience that helps to solve query performance issues. Interpreting query plans correctly is the first and major principle to troubleshoot query performance issues. When we try to find an answer to the “why is this query running slow?” question, the best starting point would be to analyze the query plan.
Pre-requirements
In this article, we will use the AdventureWorks database and we will also use the enlarging script that helps to obtain a larger copy of this database.
The second requirement for this article example is to create a copy of the Product table, and then we will use this table in our example.
|
1 2 3 4 5 6 7 8 9 10 11 12 13 14 15 16 |
CREATE TABLE [Production].[ProductListColors]( [ProductID] [int] NOT NULL, [Name] [nvarchar](50) NOT NULL, [ProductNumber] [nvarchar](25) NOT NULL, [Color] [nvarchar](15) NULL ) GO CREATE UNIQUE CLUSTERED INDEX [IX_Clustered] ON [Production].[ProductListColors] ( [ProductID] ASC, [ProductNumber] ASC ) GO INSERT INTO [Production].[ProductListColors] SELECT [ProductID],[Name],[ProductNumber], [Color] FROM Production.Product |
How to read a graphical execution plan?
A query plan shows all steps that are performed during the execution of a query and its graphical representation is the most preferred one by the developers and database administrators. This plan representation type is based on various operator icons and arrows. The plan operators represent a specific discrete action in the query plan and arrows represent the data flow direction of the query. All these icons and arrows contain various information about the query plan. Before starting to read the query plan, it is useful to take a look at the final operator because this operator includes some important details about the query plan. For instance, the following information can help to interpret the execution plan more easily:
- Cardinality Estimation Model
- Memory Grant Info
- Optimization Level
- Wait Stats
Now, let’s execute our sample query and analyze the actual query plan.
|
1 2 3 4 5 6 7 |
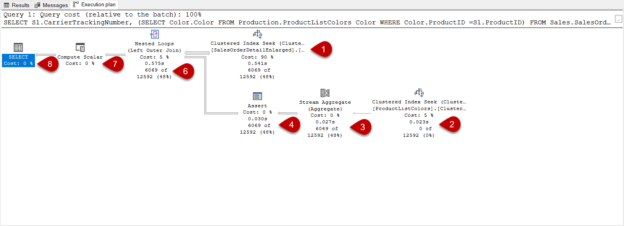
SELECT Sl.CarrierTrackingNumber, (SELECT Color. Color FROM Production.ProductListColors Color WHERE Color.ProductID = Sl.ProductID) AS ProductColor FROM Sales.SalesOrderDetailEnlarged Sl WHERE SalesOrderID > 131336 AND ModifiedDate < '20110601'; |
At first, we will glance at the select operator attributes because it is the final operator for our sample query plan.

Query memory grant is used to store temporary row data during the execution of the query but, there isn’t any operator that needs memory for this query. For this reason, all MemoryGrantInfo child attributes show the zero. NonParallelPlanReason specifies, why the query optimizer does not generate a parallel plan. OptimizationLevel attribute value is FULL and it means that the optimizer completes all query optimization phases. WaitStats attribute shows which wait types occur during the execution of the query.
After completing all these quick checks about the query, we can start to read the execution plan. The graphical query plans can begin to read top to bottom and right to left. According to this instruction, we can begin to interpret the query plan from the clustered index seek which is numbered as 1.

The clustered index seeks operator shows that the data engine finds the matched rows using the b-tree structure and also this is an efficient way to read the data. The clustered index contains all rows data in the leaf level index pages and this is the essential advantage of the clustered index seek because it can directly access the qualified rows. When we hover over the mouse on the clustered index operator, the tooltip will be shown and it contains detailed information about the clustered index operator.

In clustered index tooltip, we can easily realize that a range scan method is performed when we observe the seek predicates attribute. In this method, SQL Server reaches into the first row that matches the specified filter condition, and then it begins to scan all index pages until to reach the non-qualified row. This is because there is a logically ordered interconnection between the index pages and these pages include sequential data according to the clustered index key column. For our example, the storage engine reaches into the index page that includes ProductID equals 131336 and then start to read all index until the end of the index. The Scan Direction attribute of the clustered index seeks property shows the scan direction.

The following image illustrates this range scan mechanism very simply.

A secret of the Index Seek
On the clustered index seek properties, the first point that can leap to eyes is a dramatic difference between the Number of Rows Read and the Actual Number of Rows. The Number of Rows Read attribute indicates the total number of the rows that have read by the underlined operator. On the other hand, the Actual Number of Rows attribute gives information about how many rows are returned from the operator.

In order to figure out this issue, we need to look at two terms:
- The seek predicate is the first filter that is implemented to data and it uses the b-tree structure to find the matching row(s)
- The residual predicate is the second applied filter and it is performed after the seek predicate to filter the non-key column
For our example, the index seek operator directly access the 4.603.975 number of rows, and then all these rows are filtered because of the ModifiedDate condition so the matched rows are decreased to 6069 rows. This issue causes to consume more I/O because of the read irrelevant rows.
The hidden sides of the execution plan
The second index seek operator which is numbered as 2 tasks is to access ProductListColors and return the Color row according to ProductId. The number of executions attribute identifies this operation was performed 6069 times.

In general, we don’t see an assert operator in the select queries because the assert operator task is to validate certain conditions in the query plan. For example, when we insert a row into the table that includes either check constraint or foreign key constraint, the assert operator validates the inserted value. In the following query execution, we will see an assert operator that validates the inserted value.
|
1 2 3 4 5 6 7 |
CREATE TABLE #TestInsert (Id INT IDENTITY(1, 1) PRIMARY KEY, Age INT CHECK(Age >= 10) ); GO INSERT INTO #TestInsert VALUES(21); |

The predicate expression shows, how the inserted value is evaluated by this operator. The important point is that the predicate expression output must be NULL otherwise the query returns an error.
The other operator seems in the execution plan is the stream aggregate operator, this operator’s task is to perform aggregation operations. Now let’s begin to interpret our sample query plan in the light of this information. The index seeks operator finds the matched row(s) and pass it into the stream aggregate operator.

The stream aggregate operator returns one row that includes Expr1004 and Expr1005 columns.

These two output column rows are used for different purposes by the query optimizer. The Expr1004 returns the number of records for each ProductId and sends it to the assert operator.

The Expr1005 column returns only one color value because of the ANY function.

The Expr1004 and Expr1005 column rows are sent to the assert operator and the assert operator evaluates the Expr1004 column value according to its predicate expression. The nested loop operator combines the rows using the left outer join so that if any SalesOrderId does not exist in the ProductListColors, the Color column data will be null.
Compute scalar operator only computes a new column without any calculation, the Expr1005 value is assigned to Expr1003.

In the final section of the query plan, the select operator begins to return the result set.
The UNIQUE constraint and execution plan interaction
The unique constraint can change the query plan of the queries. Such as, when we add a unique constraint for the ProductID column, the query plan of the query will change.
|
1 2 |
ALTER TABLE Production.ProductListColors ADD UNIQUE (ProductID); |

The reason for this change in the query plan is the unique constraint because the query optimizer knows that the ProductListColors table does not contain any duplicate row for the ProductId data. In this circumstance, the execution plan is changed by the query optimizer.
Conclusion
In this article, we have talked about the importance of the execution plan to analyze query performance. Query plans give us numerous pieces of information about the execution steps of the query via the plan operator and arrows. Shortly, query plans play a key role in query performance tuning struggles when interpreted correctly.

Most of his career has been focused on SQL Server Database Administration and Development. His current interests are in database administration and Business Intelligence. You can find him on LinkedIn.
View all posts by Esat Erkec
- SQL Performance Tuning tips for newbies - April 15, 2024
- SQL Unit Testing reference guide for beginners - August 11, 2023
- SQL Cheat Sheet for Newbies - February 21, 2023