
Our new Problems REST API v2 fully delivers the Davis® AI power for third-party tools, allowing you to resolve Dynatrace detected problems faster in your third-party tool of choice.
Dynatrace v2 APIs transform your entire organization by making it easy to get started with monitoring automation and to solve your business problems with data-driven answers.
A few months ago we wrote about how you can scale your API operations with our version 2 APIs, by showing off the Dynatrace Metrics API v2 and the Monitored entities API v2. Today we’re happy to announce a further API that will make your life easier: our brand new Problems REST API v2.
Leverage the power of the Davis® AI with the new Problems REST API v2
Davis, our radically different AI causation engine, automatically processes billions of dependencies and pinpoints the root cause of performance issues with unmatched precision. To achieve this, Davis uses powerful AIOps capabilities such as automatic impact assessment for detected problems and the grouping of all critical raw information related to each incident.
We know how crucial this information can be when it comes to reporting, analyzing long-term trends, or identifying problem entities in your infrastructure. To allow you to resolve Dynatrace detected problems faster in your third-party tool of choice, but also to build feature-rich analysis and reporting use cases on top of Dynatrace Davis-analyzed results, our new Problems REST API v2 fully delivers the Davis AIOps power for third-party tools.
We deliberately chose an API-first approach in designing our own new web UI for the Problems list view to ensure that external integrations receive the same level of expressiveness through the public REST API. All filters and problem meta-information that are available in our own problem list are now seamlessly available through the public Problems REST API v2. Among other use cases, the this will allow you to:
- Analyze and understand long-term trends by easily paging through millions of detected problems and jumping to specific pages
- Use powerful filters to focus on the problems you’re most interested in
- Define SLOs and KPIs for your services by fetching root cause details across the Problems, Metrics, and Events API endpoints
- Easily identify the problems that affect most of your real users by accessing impact-related information
Read on below to understand the benefits of the new API and possible use cases for leveraging its newly added capabilities.
Analyze and understand long-term trends by easily paging through millions of detected problems and jumping to specific pages
You might want to quickly and efficiently page through the millions of Dynatrace Davis-detected events and problems in an external UI rather than scrolling through them in one long list.
To provide better accessibility and the ability to track results on a per-page basis, the new Problems v2 and Events REST APIs allow you to page through a huge query result—you can load more results and access specific pages within these results. The paging follows a cursor-like approach, which means that, in your first query, you specify the page size of each individual result and then use the returned cursor to navigate from the first result page to the last.
A typical use case is the display of problems in an external UI and offering a paged or lazy-loading approach that allows the user to load more results on demand. Let’s say that you want to page through all the problems that were detected within the last year and return the result in page sizes of 50 problems per request. See the example request below for querying the first page:
https://YOUR_ENV.live.dynatrace.com/api/v2/problems?from=-1y&pageSize=50
The result shows the first 50 problems ordered in the sequence in which they were detected, the total count of the problems (6336), and the cursor (nextPageKey) to get the next page.
{
"totalCount": 6336,
"pageSize": 50,
"nextPageKey": "AQANMTU1MTUyNzMzNzEyNAEADTE1ODMxNDk3MzcxMjQBABwxNzA4Zj",
"problems": [ … ]
}
Note: Each incremental result returns its own nextPageKey cursor, which you must include to get to the next page.
A typical error here is to mistakenly only use the first nextPageKey cursor, which lands the user in an endless loop that continuously returns to the first page. To avoid this, request the next page by including the nextPageKey value from the previous result, as shown below:
https://YOUR_ENV.live.dynatrace.com/api/v2/problems?nextPageKey= AQANMTU1MTUyNzMzNzEyNAEADTE1ODMxNDk3MzcxMjQBABwxNzA4Zj
Use powerful filters to focus on the problems you’re most interested in
Instead of paging through a huge number of problems or events, you can now use an efficient query to target the issue you’re most interested in.
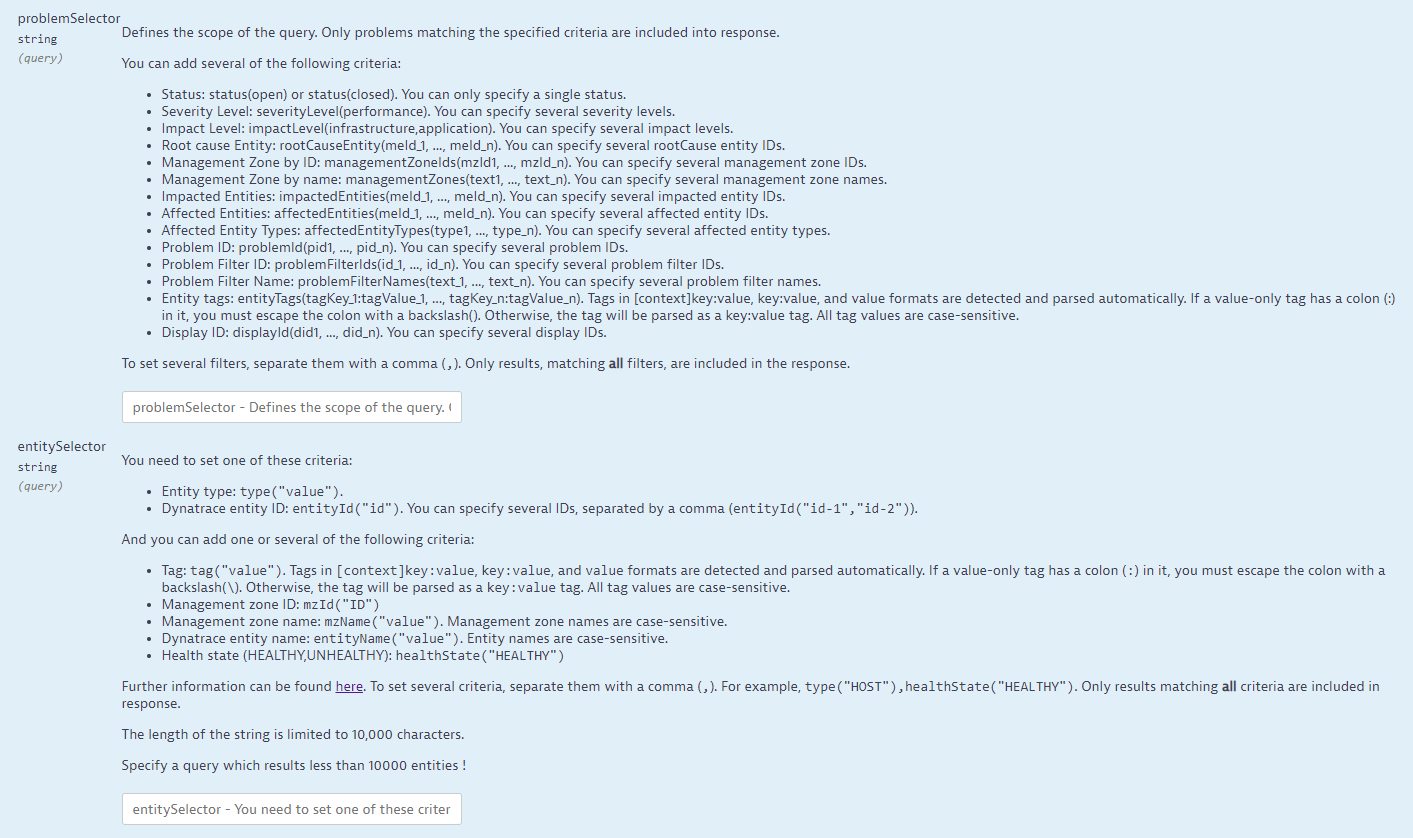
You can achieve this with the same consistent query approach that we follow in all the API v2 endpoints: by using the entitySelector as well as an endpoint and domain-specific selector, namely, the problemSelector.
By using the entitySelector, you can narrow down the query on the topology, for example, by querying problems on a specific host. The domain-specific problemSelector allows you to further narrow down the query by using problem-related attributes, such as whether a problem is in an “open” or “closed” state. The concept behind selectors is to foster interplay between endpoints. This means that the entitySelector in the Problems v2 and Events endpoints can also be used in the Monitored entities v2 endpoints to select the same subset of entities.
Let’s try a simple example query for problems that occurred on hosts within a management zone named PROD. To do this, we’ll use the entitySelector as shown below:
https://YOUR_ENV.live.dynatrace.com/api/v2/problems?from=-1y&entitySelector=type(“HOST”),mzName(“PROD”)
Note: This query is focused first on the topology and then on the problems that occurred within this topological section. You can also try to use the management-zone filter in the problemSelector to get all problems that were detected within the management zone rather than within a section of the topology.
By using the problemSelector, you can further refine the query with problem-related criteria such as problem severity level or problem status.
Define SLOs and KPIs for your services by fetching root cause details across the Problems, Metrics, and Events API endpoints
Davis detects incidents in your monitoring environment, analyzes the relevant topology, and collects all available information that indicate the ultimate root cause component. Each data hint that leads Davis in the correct direction of a root cause is called “evidence.” These hints are exposed through the new Problems REST API v2.
Root cause evidence can be manifold: baseline violation events, non-metric events (for example, process crashes), information events (for example, a deployment), or change points detected on any of the analyzed metrics. All this information is now exposed through the new Problems REST API v2, which enables further reporting.
One use case is to automatically fetch all metric-based root cause evidence for the past week and to check which metrics are the most “interesting” in this regard. Such information can then be used in Keptn to further define SLOs and KPIs for your services.
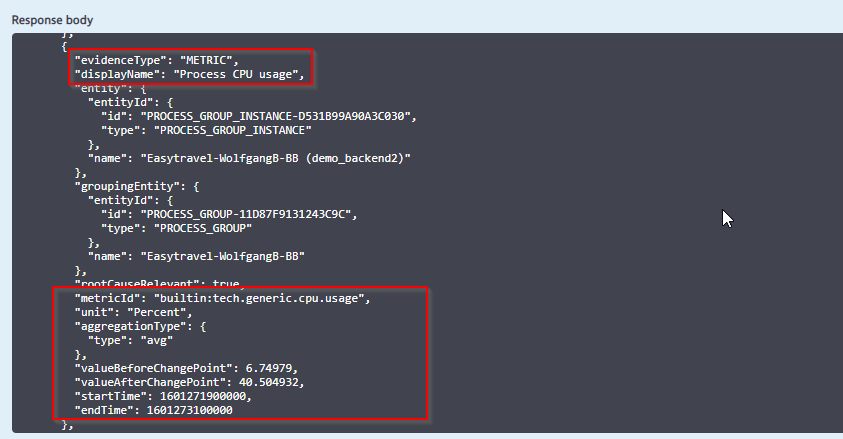
See the example below of metric-based evidence that was automatically detected by Davis during its causation run. This includes the metric name and metric identifier, which can be used seamlessly in the Metrics API v2:
See the example below of another type of evidence that’s based on an event that Davis detected on an affected topological node:
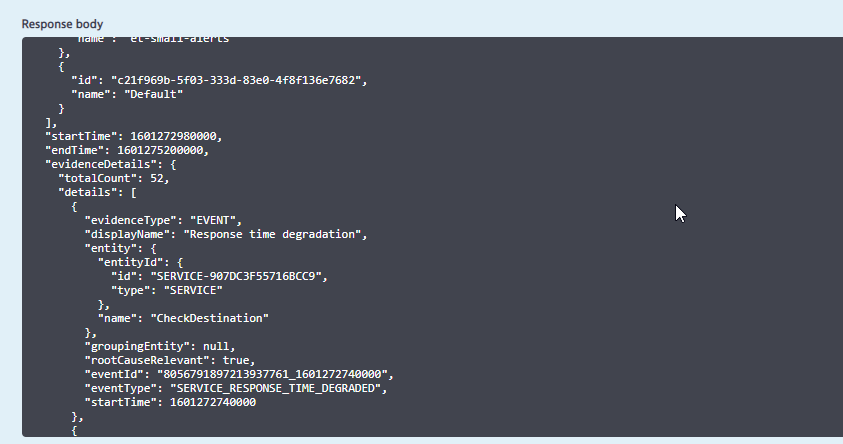
Again, as before, you can use the event ID in the evidence returned by a problem to query that event using the Events API.
Easily identify the problems that affect most of your real users by accessing impact-related information
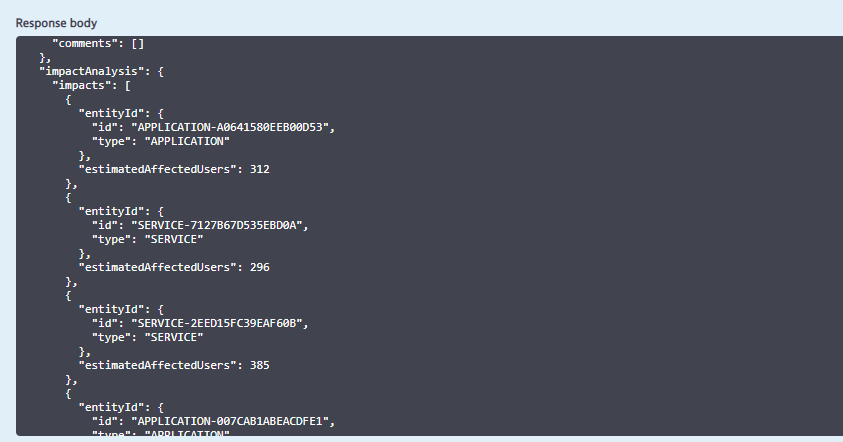
Besides the root cause, Davis AIOps impact analysis can play a major role in your reporting use cases for third-party tools. Once an incident is detected on an entity that also shows incoming transactions, Davis follows the backtrace of those transactions and identifies the entry points (that is, the application and services where those transactions originate). See the business-impact analysis example below.
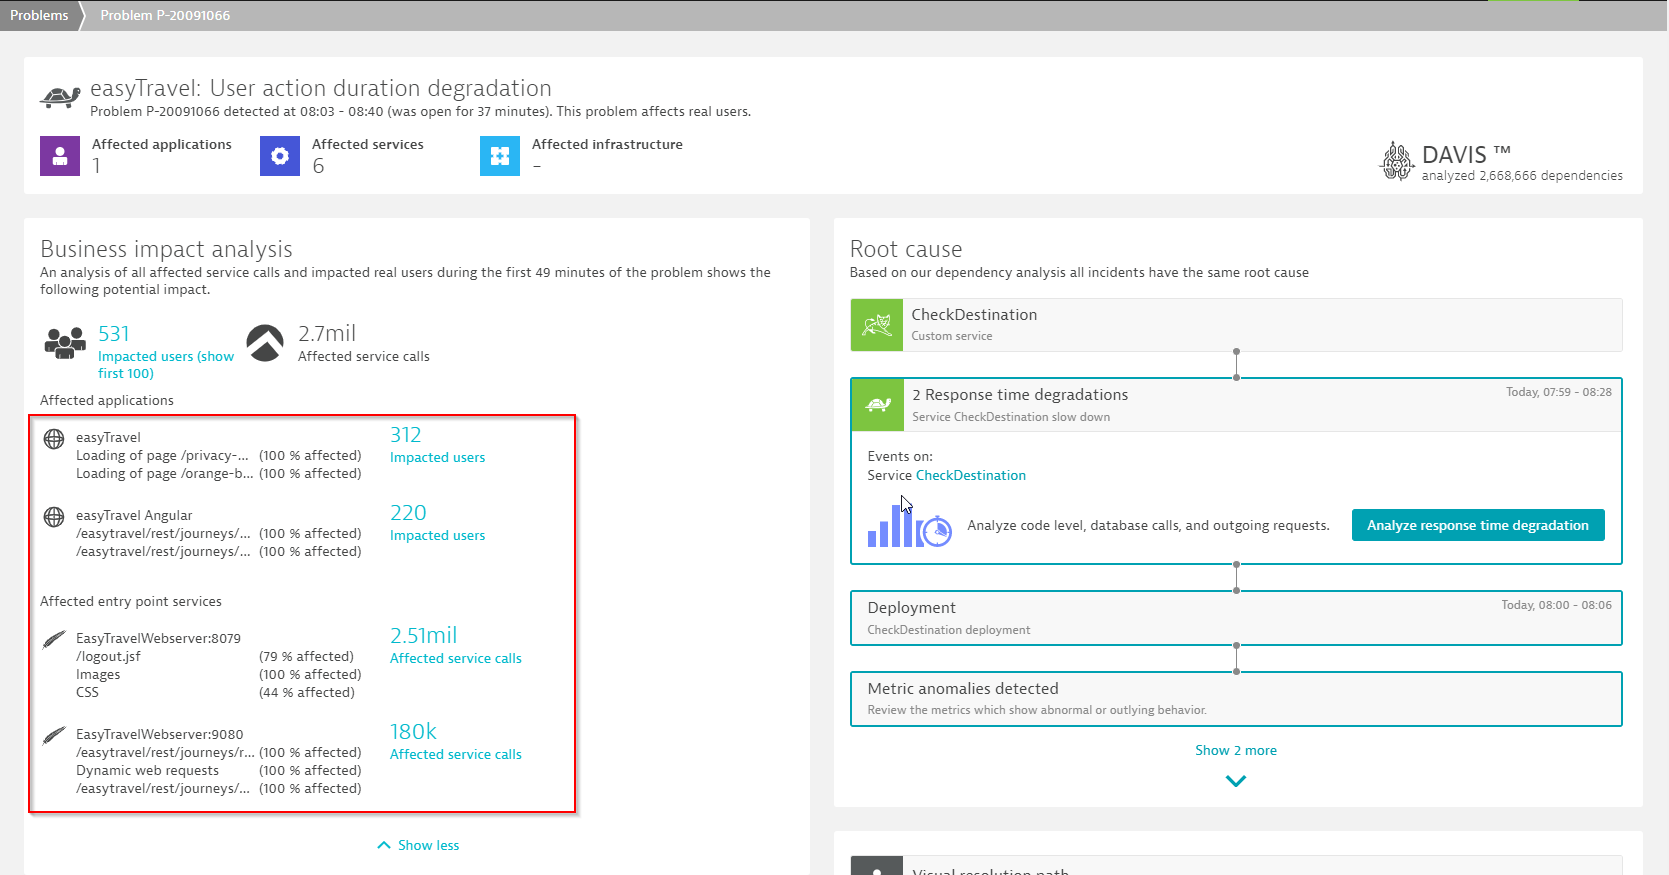
With our newly introduced Problems API v2 endpoints, external integrations can now access the same impact-related information (shown below). With this information you can, for example, check which problems affected the most real users.
Summary
With the new Problems REST API v2, powerful Davis AIOps capabilities such as the numerous filtering possibilities, paging, and export of impact and root cause information are all seamlessly exposed to pave the way for building feature-rich external analysis and reporting use cases on top of Davis analysis results from Dynatrace.
Seeing is believing
If you’re new to Dynatrace, be sure to sign up for the Dynatrace free trial. If you’re already a Dynatrace customer, sign in to your account and experience how you can boost your external analyses and reports by leveraging these powerful new Davis AIOps capabilities.


Looking for answers?
Start a new discussion or ask for help in our Q&A forum.
Go to forum