SEO and web performance: What to measure and how to optimize

Chances are, you're here because of Google's update to its search algorithm, which affects both desktop and mobile, and which includes Core Web Vitals as a ranking factor. You may also be here because you've heard about the most recent potential candidates for addition to Core Web Vitals, which were just announced at Chrome Dev Summit.
A few things are clear:
- Core Web Vitals, as a premise, are here to stay for a while.
- The metrics that comprise Web Vitals are still evolving.
- These metrics will (I think) always be in a state of evolution. That's a good thing. We need to do our best to stay up to date – not just with which metrics to track, but also with what they measure and why they're important.
If you're new to Core Web Vitals, this is a Google initiative that was launched in early 2020. Web Vitals is (currently) a set of three metrics – Largest Contentful Paint, First Input Delay, and Cumulative Layout Shift – that are intended to measure the loading, interactivity, and visual stability of a page.
When Google talks, people listen. I talk with a lot of companies and I can attest that, since Web Vitals were announced, they've shot to the top of many people's list of things to care about. But Google's prioritization of page speed in search ranking isn't new, even for mobile. As far back as 2013, Google announced that pages that load slowly on mobile devices would be penalized in mobile search.
Keep reading to find out:
- How much does web performance matter when it comes to SEO?
- Which performance metrics should you focus on for SEO?
- What can you do to make your pages faster for SEO purposes?
- What are some of the common issues that can hurt your Web Vitals?
- How can you track performance for SEO?
How much does web performance matter when it comes to SEO?
Performance has had an impact on SEO long before Web Vitals came along.
Back in 2011, Smartfurniture.com shared:
"We discovered we could make a quantum leap in search engine rankings simply by increasing site performance. Across the board, we’ve seen sales increases because of our improved ranking, with 20% more organic traffic being driven to our site and 14% more page views."
More recently, Pinterest shared that rebuilding their site with performance in mind resulted in a 15% increase in organic search traffic. (You can find more SEO-related case studies at WPOstats.com.)
Great performance isn't a substitute for poor content
As much as I'm an advocate for performance, I'm a greater advocate for overall user experience. And when it comes to user experience, quality content is still king. Google acknowledges this as well, which warms my heart:
"While page experience is important, Google still seeks to rank pages with the best information overall, even if the page experience is subpar. Great page experience doesn't override having great page content. However, in cases where there are many pages that may be similar in relevance, page experience can be much more important for visibility in Search."
Assuming that your content is amazing, let's move on to the next question. :)
Which performance metrics should you focus on for SEO?
In the big picture, SEO is about more than Google and Core Web Vitals.
However, Google has a global market share of almost 87%, and it's the only search engine that factors page speed into its algorithm. So for our purposes as web performance folks, Google controls where the goal posts go.
As said, Google has drawn a clear line from search to performance with Core Web Vitals. Currently, these are the metrics that comprise Web Vitals:
- Largest Contentful Paint (LCP) – The time at which the largest element in the viewport is rendered. It's only tracked on certain elements, e.g., IMG and VIDEO (learn more here).
- First Input Delay (FID) – The amount of time it takes for a page to respond to a user input, such as a click, key, or tap (learn more here).
- Cumulative Layout Shift (CLS) – A score that captures how often a user experiences unexpected layout shifts as the page loads. Elements like ads and custom fonts can push important content around while a user is already reading it. A poor CLS score could be a sign that page feels janky to your users (learn more here).
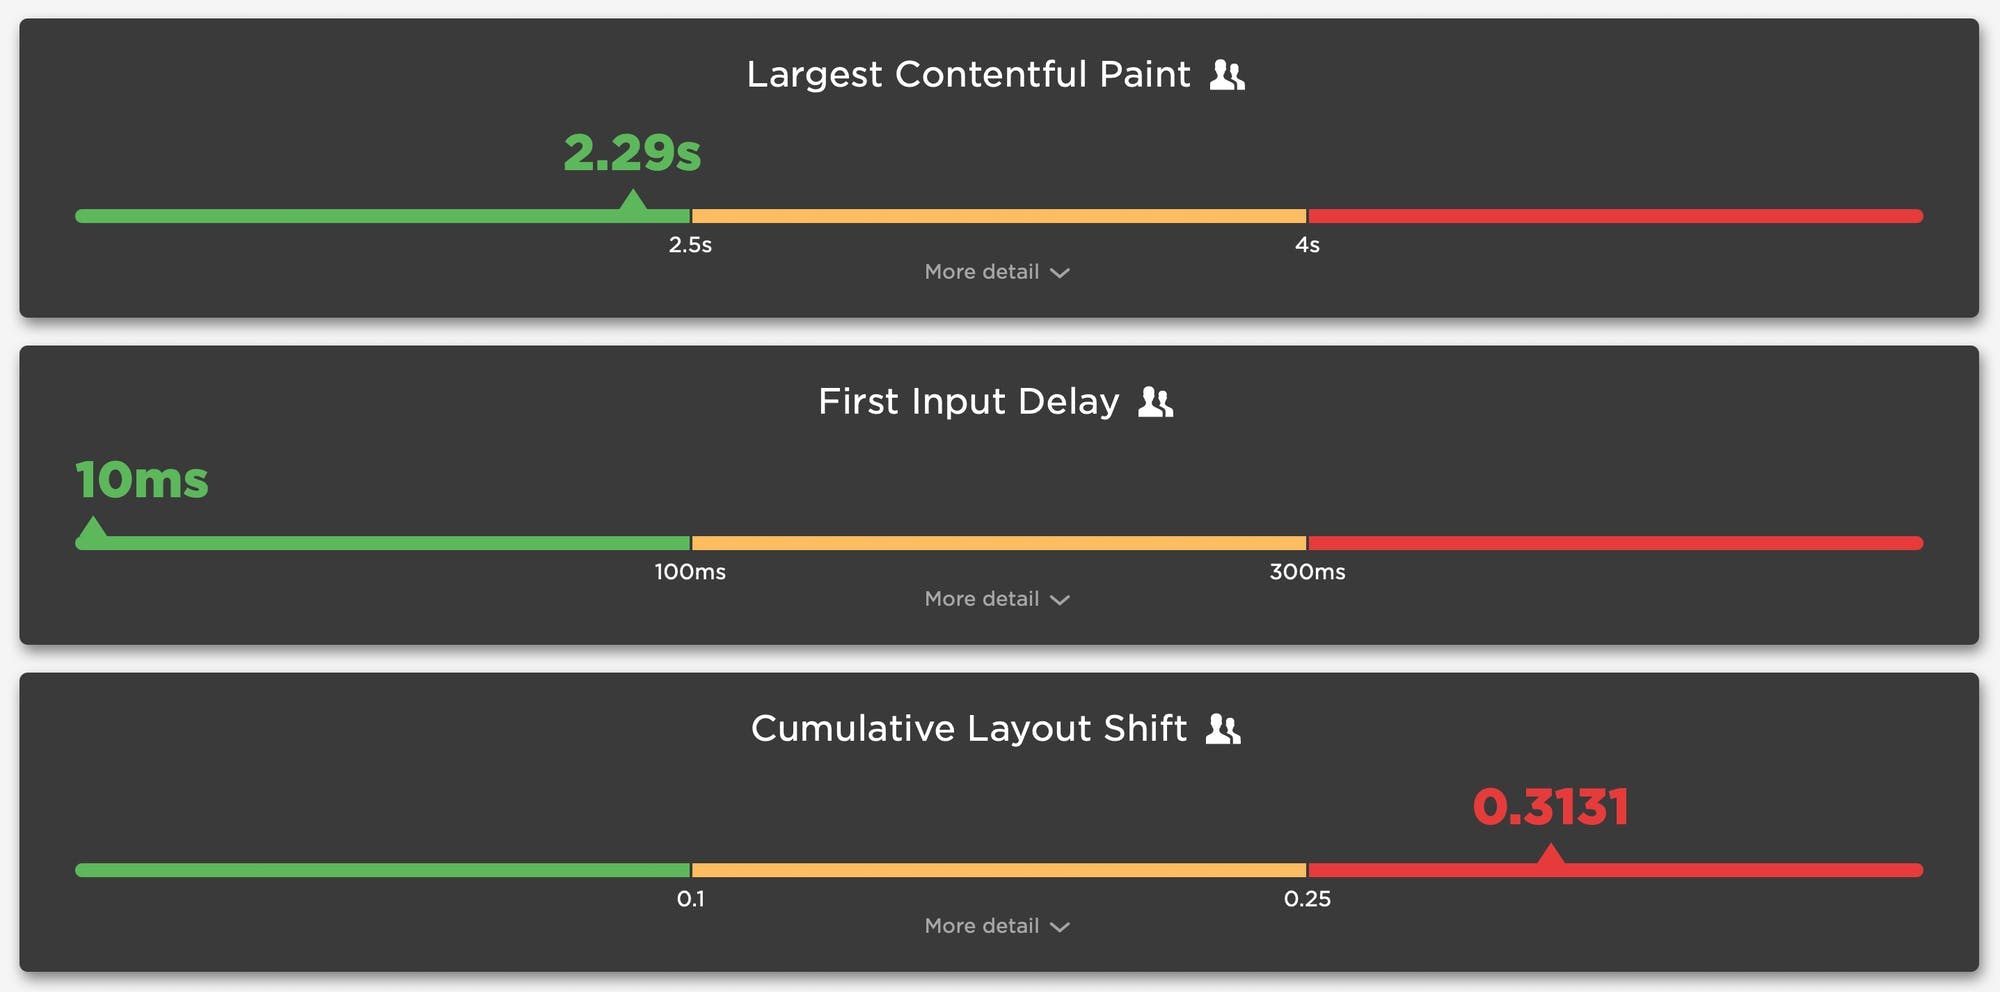
Google has also defined thresholds for "Good", "Needs Improvement", and "Poor". These are the same thresholds that you see in our Vitals dashboard, pictured here:
You should know that Google is exploring other goals and metrics for potential inclusion in Web Vitals down the road:
- Responsiveness – Think of this as an expansion to First Input Delay. Whereas FID measures initial interaction delay, a more robust interactivity metric would capture the entire event duration, giving you a better idea of how well the page responds throughout a user's engagement with it (learn more here).
- Smoothness – Given the proliferation of animated content on the web, this is a much-needed metric for measuring how smoothly animation is rendered on the page (learn more here).
What can I do to make my pages faster for SEO?
Okay, that was a trick question. I don't believe you should be making your pages faster for SEO purposes.
You should be making your pages leaner and faster because it makes your users happier and consumes less of their data, especially on mobile devices. Not surprisingly, happier users spend more time (and more money) on your site, are more likely to return, and are more likely to recommend your site to others.
Having said that, there are a number of things you can do to fix your pages, improve user experience, and ultimately boost your Web Vitals results. If you want to make your pages faster, the first places to look at are images and render-blocking resources. I'm not a developer and don't pretend to be one, so here are some great resources from devs and engineers who are very well versed in Web Vitals (and performance in general).
1. Optimize images
Google engineer Addy Osmani recently did a great talk about image optimization at Smashing Meets for Speed. A quick summary of his main tips:
For faster LCP...
- Request key hero image early
- Use <picture>, srcset, and efficient modern image formats
- Use compression
- Lazy-load offscreen images
For lower CLS...
- Set height and width dimensions
- Use CSS aspect-ratio or aspect-ratio boxes
For better FID...
- Avoid images that cause network congestion with critical CSS and JS
2. Eliminate/reduce render-blocking resources
Blocking CSS and JavaScript are bottlenecks that hurt your LCP times. In this post, Google Dev Expert Sia Karamalegos goes deep on how to identify and eliminate render-blocking resources.
3. Take advantage of proven Web Vitals patterns
There are so many common page elements – such as carousels, banners, videos, and custom fonts – that can have a serious negative impact on your performance metrics. This is a handy collection of common UX patterns – including code examples that you can use on your own pages – that have been optimized for Core Web Vitals.
How to use SpeedCurve to track performance for SEO
You can track Web Vitals in both Synthetic and RUM. Your Synthetic tests also include Lighthouse scores and audits for each test run.
1. Baseline your current performance
Before you do anything else, you need to understand how your pages perform relative to Google's thresholds. It's important to note that Google advises that you focus on RUM data at the 75th percentile. If you're using SpeedCurve RUM, that's what we show you by default in your Vitals dashboard.
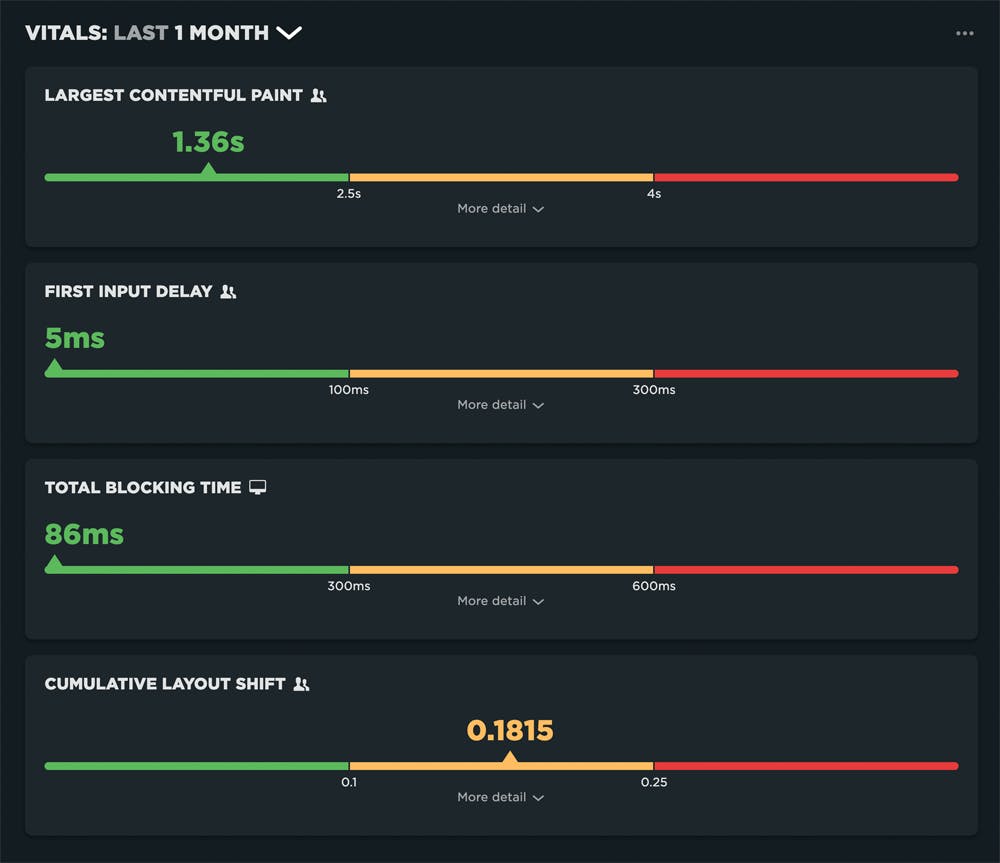
If you're not using RUM, then you can see your median Synthetic results for Largest Contentful Paint, Total Blocking Time, and Cumulative Layout Shift. (We can't show you First Input Delay, as that's an interaction metric that can only be gathered from real users.) While we plot these metrics against Google's recommended thresholds, take this with a grain of salt, as synthetic test results tend to be slower than RUM. If you're only using synthetic testing, the more important thing to focus on is establishing a baseline for your pages.
MORE: Using the Vitals dashboard [VIDEO]
2. Create an SEO dashboard in your Favorites
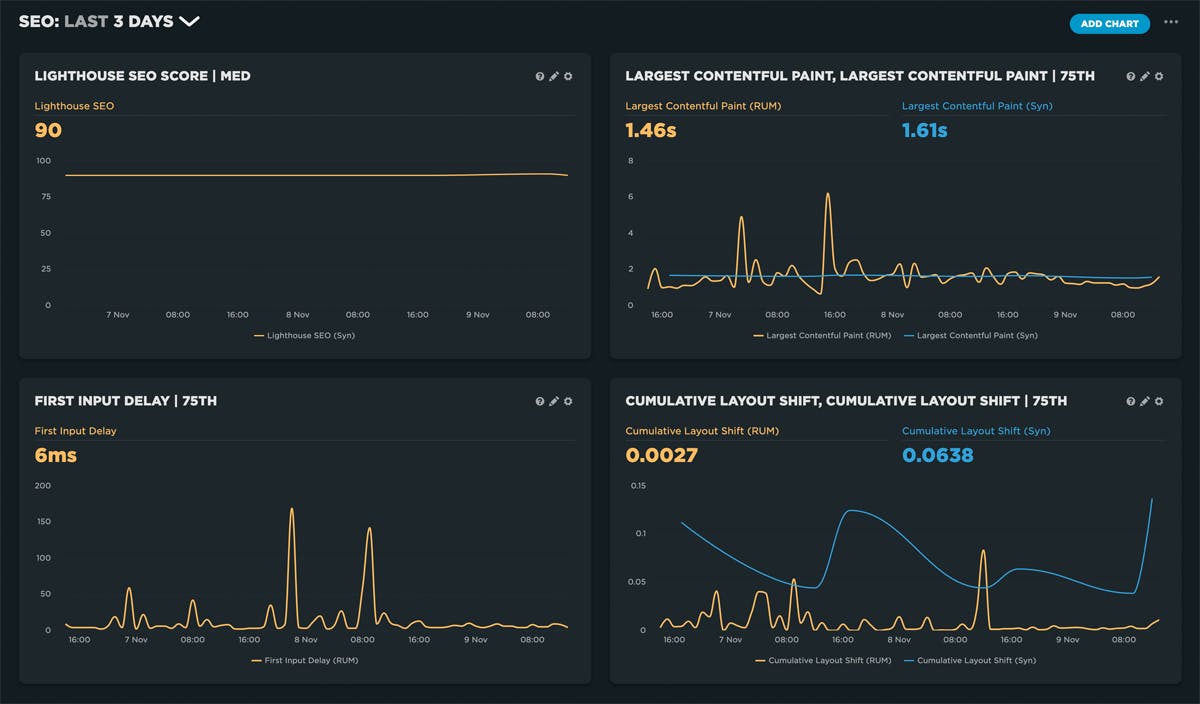
You can create as many dashboards as you like in your Favorites. You can create a dashboard that focuses solely on search-related metrics, including separate charts for each of the Web Vitals and Lighthouse SEO scores. It can look as simple as this:
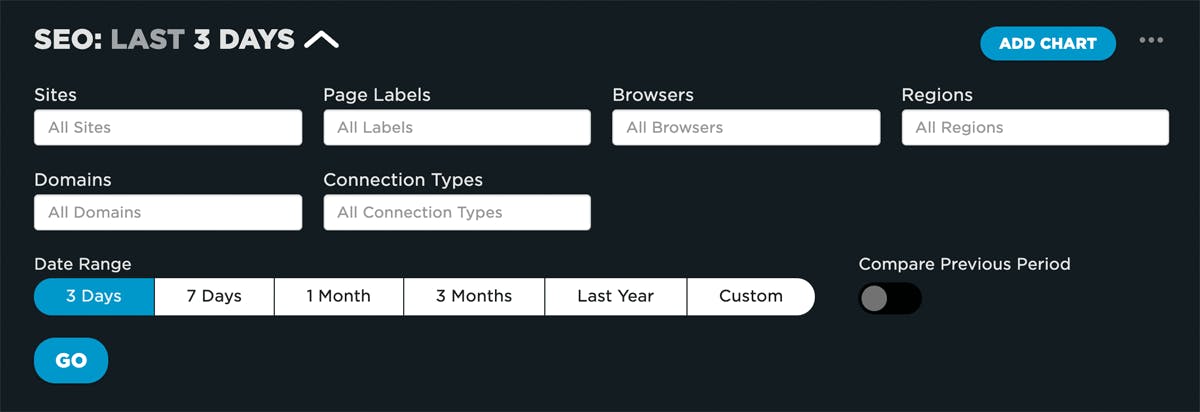
Remember that your dashboards and charts don't have to be complex, because you can use the filters at the top of the dashboard to refine your charts:
MORE: Tracking Web Vitals with SpeedCurve [VIDEO]
3. Set performance budgets and alerts
A performance budget is a numeric threshold that you apply to your metrics. You can then configure your monitoring tools to send you alerts – or even break the build, if you're testing in your staging environment – when your budgets are violated. You can learn much more about performance budgets here, but for our purposes in this post, the important thing to understand is that performance budgets are NOT the same as performance goals:
- Your performance goals are aspirational. They answer the question: How fast do I want to be eventually?
- Your performance budgets are practical. They answer the question: How can I keep my site from getting slower while I work toward my performance goals?
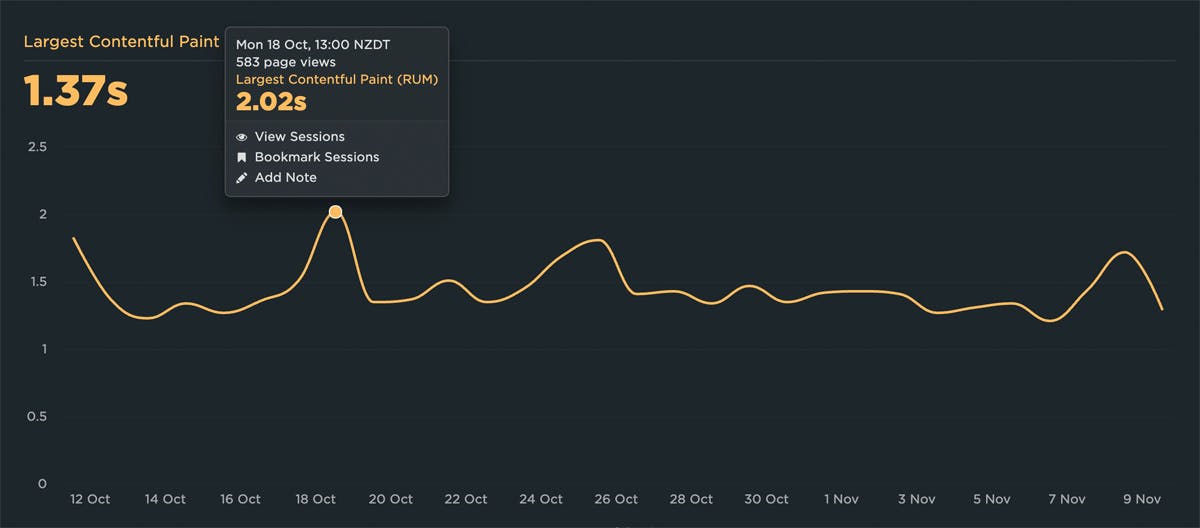
A good practice is to look at your last 2-4 weeks of data for a given metric, identify the worst number, and then set your performance budget for that number. For example, looking at the last month of LCP data (captured using RUM, at the 75th percentile), we see that the worst number was 2.02 seconds. So a good performance budget for LCP would be 2.02 seconds.
4. Find out exactly what to fix
If you have both RUM and synthetic data, it can be helpful to plot both in the same chart. That way, if you get an alert on one of your RUM metrics, you can drill down into your synthetic test data, which is where your Lighthouse scores and audits live, along with your waterfall charts and other diagnostic information. For example, by adding synthetic test data to the same chart we looked at above, we can see that there's a spike in the LCP number for synthetic alongside the high LCP number in RUM:
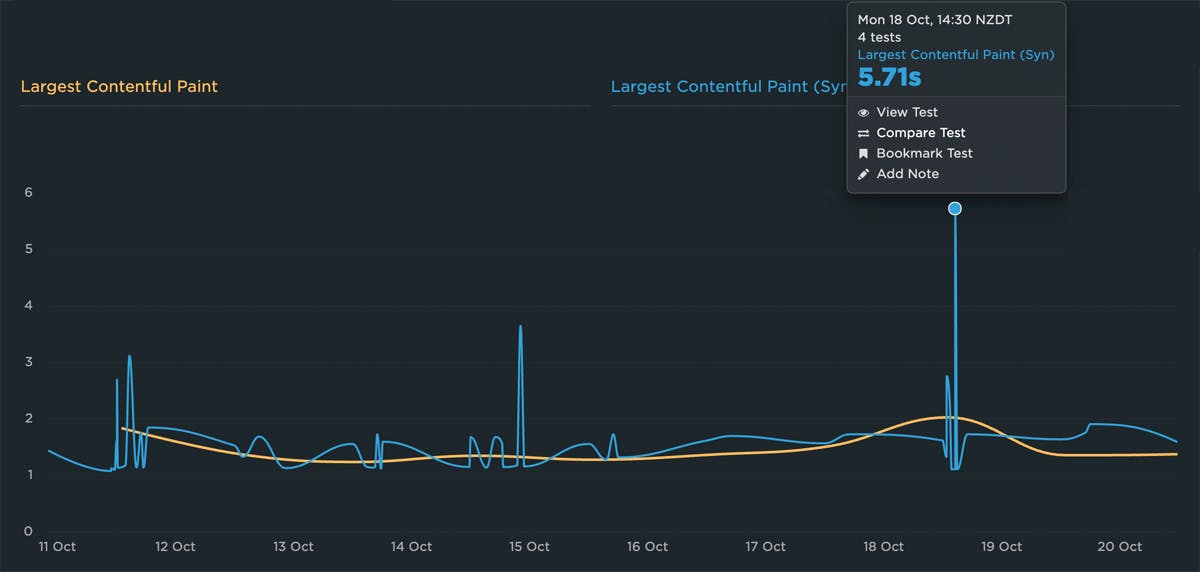
Clicking the 'View Test' link takes you to detailed test results, where you can:
- See what your Largest Contentful Paint (LCP) element is and when it's rendering
- Diagnose Cumulative Layout Shift (CLS) issues
- Review Lighthouse SEO audits to get detailed recommendations about what to fix
5. Stay vigilant
Performance and SEO are always evolving. That means you need to stay up to date on which metrics to track and how those metrics are faring on your own pages. You should routinely audit your metrics and your performance budgets – ideally on a monthly basis.
How do you monitor performance and SEO?
If you have any insights, feedback, or questions, I'd love to hear it! Reply in the comments or send us a note at support@speedcurve.com.
Read Next

See how customers are using SpeedCurve to make their sites faster.

See industry-leading sites ranked on how fast their pages load from a user's perspective.