
Dynatrace now provides carefully curated self-monitoring dashboards for each Dynatrace Managed account (Preview program closed).
As a software intelligence platform, Dynatrace is woven into the fabric of your business systems, actively managing and providing self-healing capabilities for all aspects of your applications and vital infrastructure. This makes Dynatrace a critically important enablement platform. Or, as one customer put it:
“Dynatrace is a tier-0 application. It is more critical to our business than any other revenue-driving application.”
— A Dynatrace Managed customer
Meeting the requirements of a tier-0 application demands the highest level of reliability and scalability, which Dynatrace enables through extensive self-monitoring and self-healing across the entire application stack down to the infrastructure level. Dynatrace Mission Control collects the health monitoring observability metrics for both our Dynatrace SaaS as well as Dynatrace Managed customers. Dynatrace Managed operates as a SaaS solution that keeps your data and data analysis on-premise in your own data center, thereby fulfilling the highest privacy and regulatory needs. However, providing insight into a certain portion of Mission Control health monitoring of Dynatrace Managed deployments has to-date only been available to Dynatrace ONE Premium customers.
As Dynatrace deployments grow rapidly, we’re making it easier for Dynatrace Managed customers to proactively monitor and plan their network, storage, and compute power requirements—so that we can deliver the SaaS experience on top of it. With the latest Dynatrace release we provide detailed cluster health insight for all Dynatrace Managed customers. This means you get insights into utilization, load patterns, scalability, capacity, and the problems that self-healing needs to remediate.
Access your cluster health data in Dynatrace Managed
While Dynatrace ONE Premium customers have had full access to their self-monitoring data through a dedicated environment for some time now, we’ll now begin providing access to carefully curated self-monitoring dashboards via separate management zones for each customer account. This means that you’ll get three dashboards per management zone, one for each focus area.
An illustration of the cluster overview dashboard is shown below. Metrics are provided for general host info like CPU usage and memory consumption, OneAgent traffic, and network latency. CPU usage and suspension rates for cluster node processes (namely Server, Cassandra, (embedded) ActiveGate, and Elasticsearch) are also visualized.
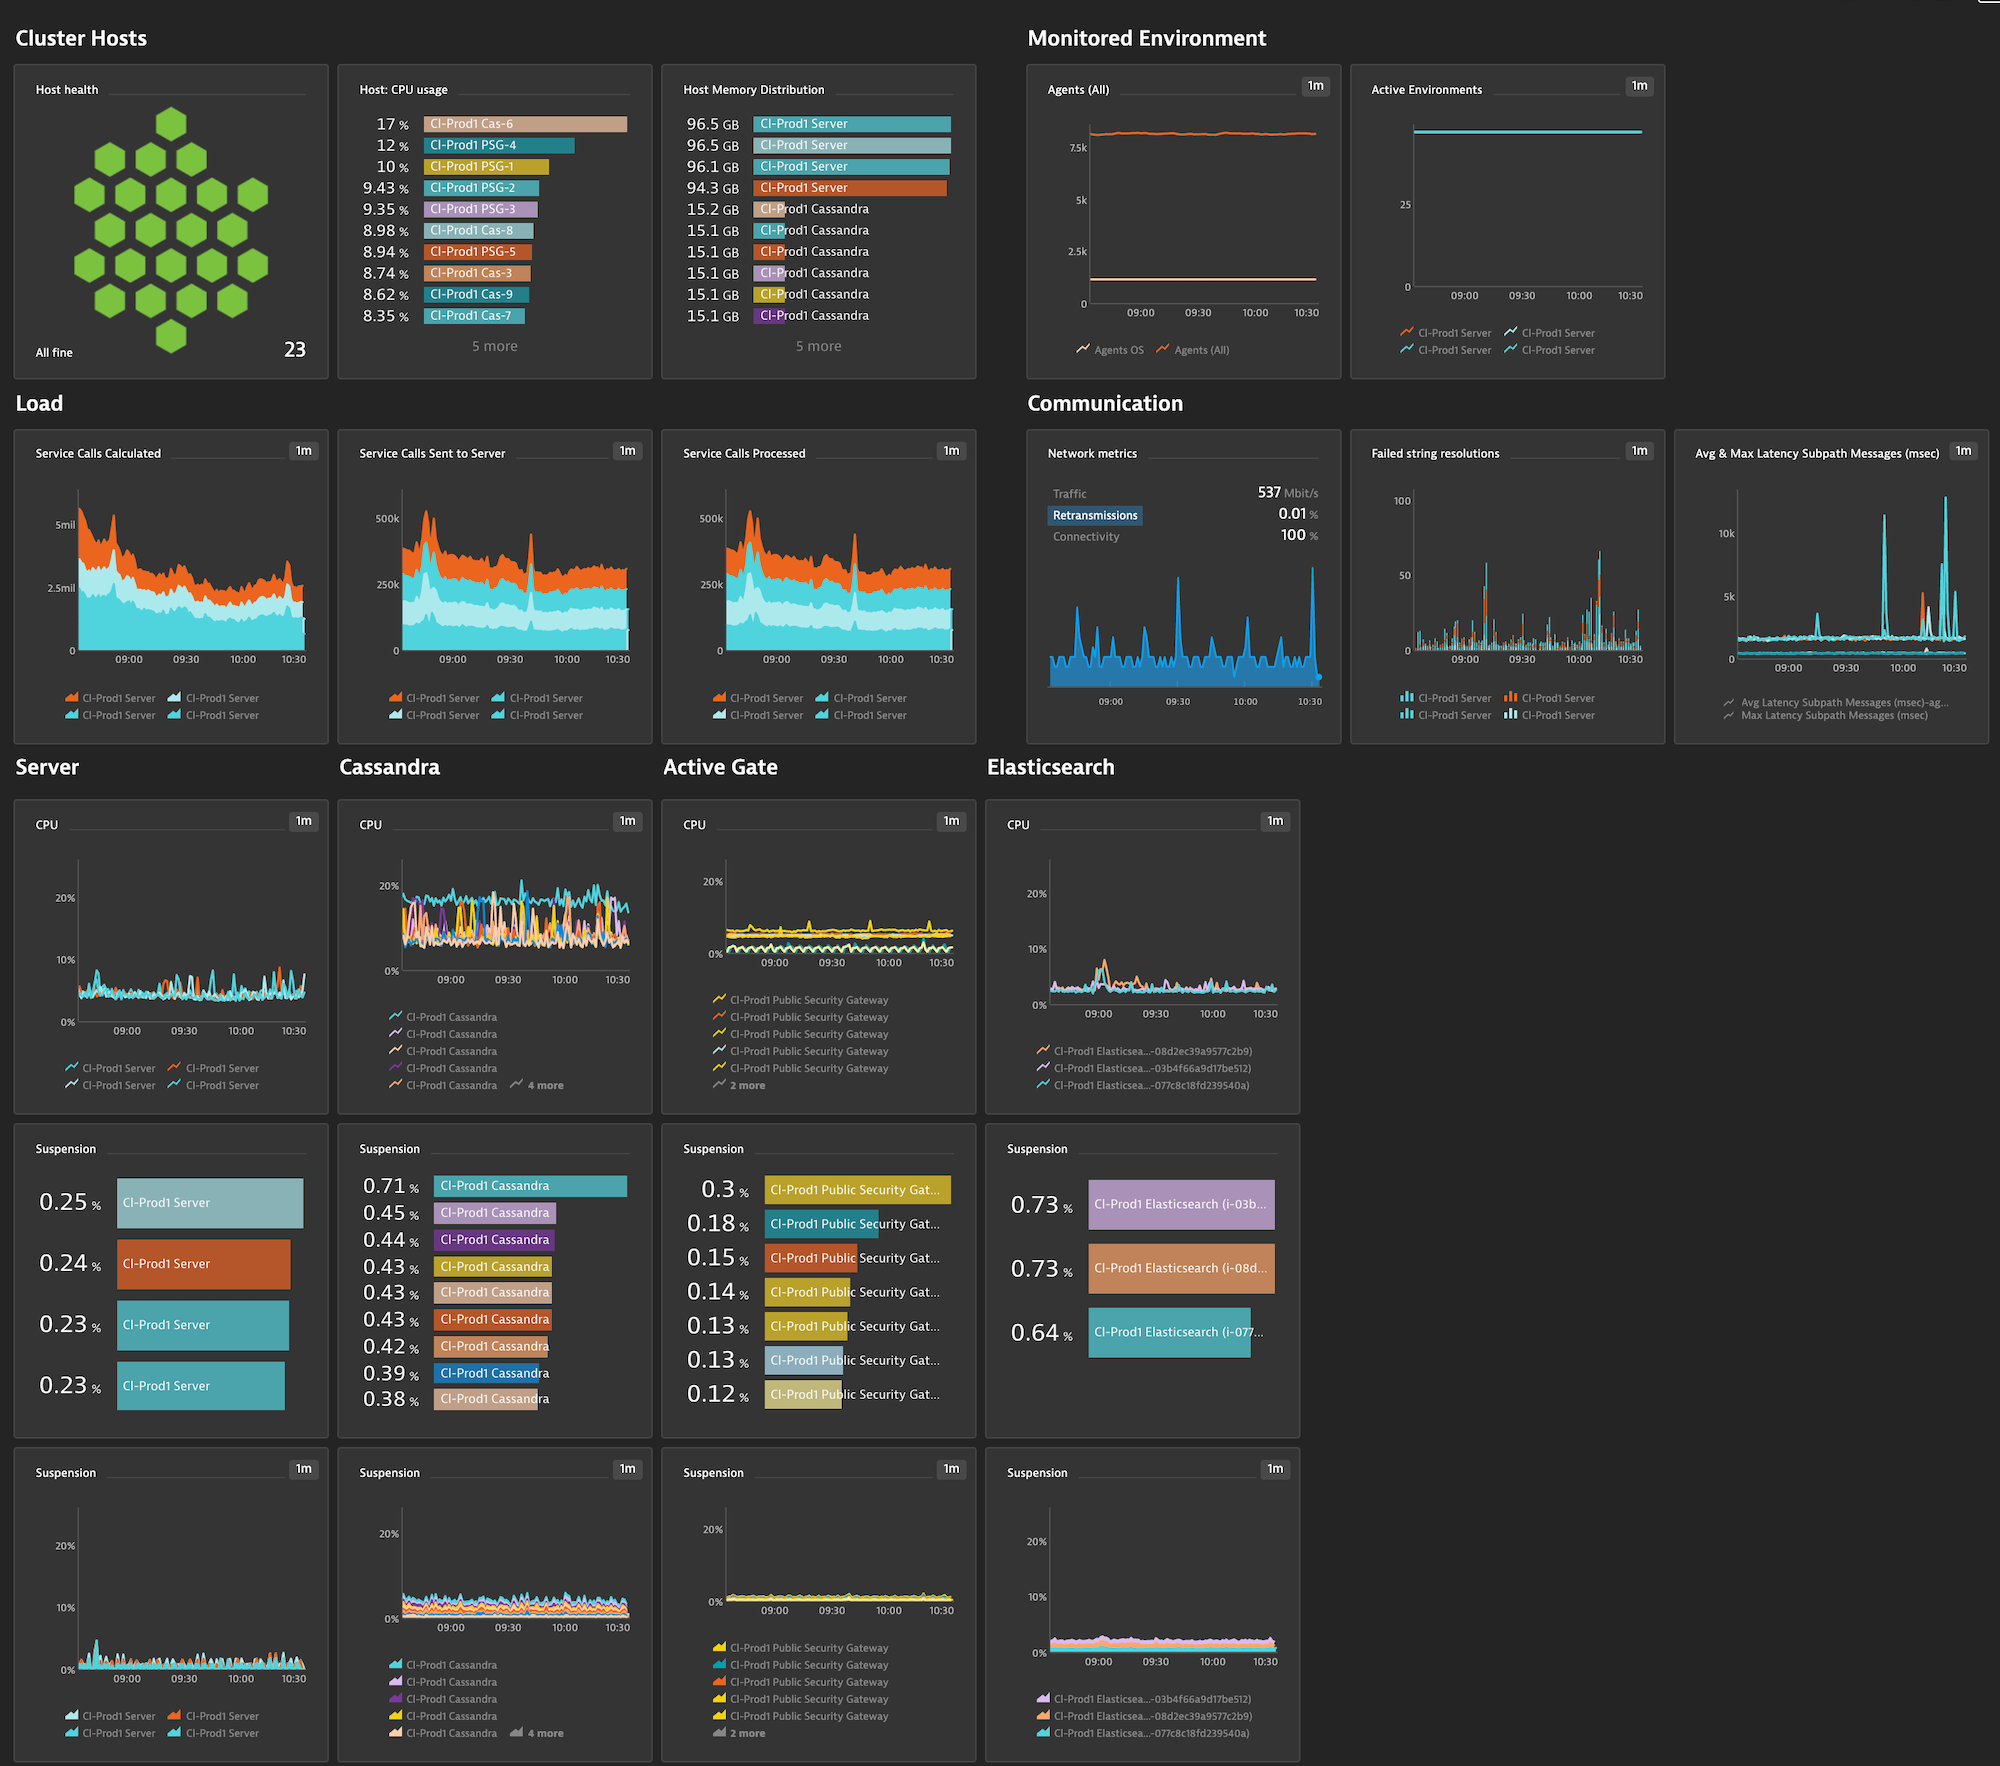
In addition to the cluster overview dashboard, we also provide a separate dashboard for more detailed server process metrics and another dashboard for Cassandra metrics.
Disclaimer
Please note that the Preview program for self-monitoring dashboards for Dynatrace Managed clusters has been closed. We’d like to say thanks for the many responses. The participants will receive a follow-up email shortly.
What’s next
Based on the feedback and learnings gathered in the Preview we take the necessary action towards providing self-monitoring for managed customers.
As always, we welcome your feedback and comments. Please share your thoughts about the new cluster-overview dashboards via Dynatrace Community, or contact a Dynatrace ONE representative via in-product chat.


Looking for answers?
Start a new discussion or ask for help in our Q&A forum.
Go to forum