
Dynatrace brings scale, zero configuration, automatic AI driven alerting, and root cause analysis to all your custom metrics—now including open source observability frameworks like StatsD, Telegraf, and Prometheus.
We’re happy to announce that by opening up Dynatrace OneAgent for integration of custom metrics, Dynatrace has automated alerting on crucial metrics and removes the need to maintain local configurations for StatsD, Telegraf, and Prometheus—even in the largest of environments, which can include hundreds of thousands of instances and containers. Moreover, Dynatrace has introduced enterprise-grade security features and encryption to the mix.
At the same time, you can now simply flip a switch to begin ingesting observability data from these tools into the Dynatrace platform, all while retaining your investment and increasing the value you get from Dynatrace.
Open-source metric sources automatically map to our Smartscape model for AI analytics
With this announcement, Dynatrace brings the value of its AI engine, the scale, security, and automation of Dynatrace OneAgent and the scale of our platform (which can handle 50,000 hosts) to open source technologies so that you get the best of both worlds.
We’ve just enhanced Dynatrace OneAgent with an open metric API. We’ve also enabled Dynatrace OneAgent to serve as a seamless drop-in replacement for StatsD. As proof of how valuable this is, we’ve added an integration to Telegraf, which allows you to benefit from the 200+ plugins that Telegraf provides at enterprise scale. By automatically feeding these captured metrics into our Smartscape topology model and Davis AI, we eliminate the need for manual maintenance of hundreds of alerts thanks to our true and trusted auto-adaptive baseline engine.
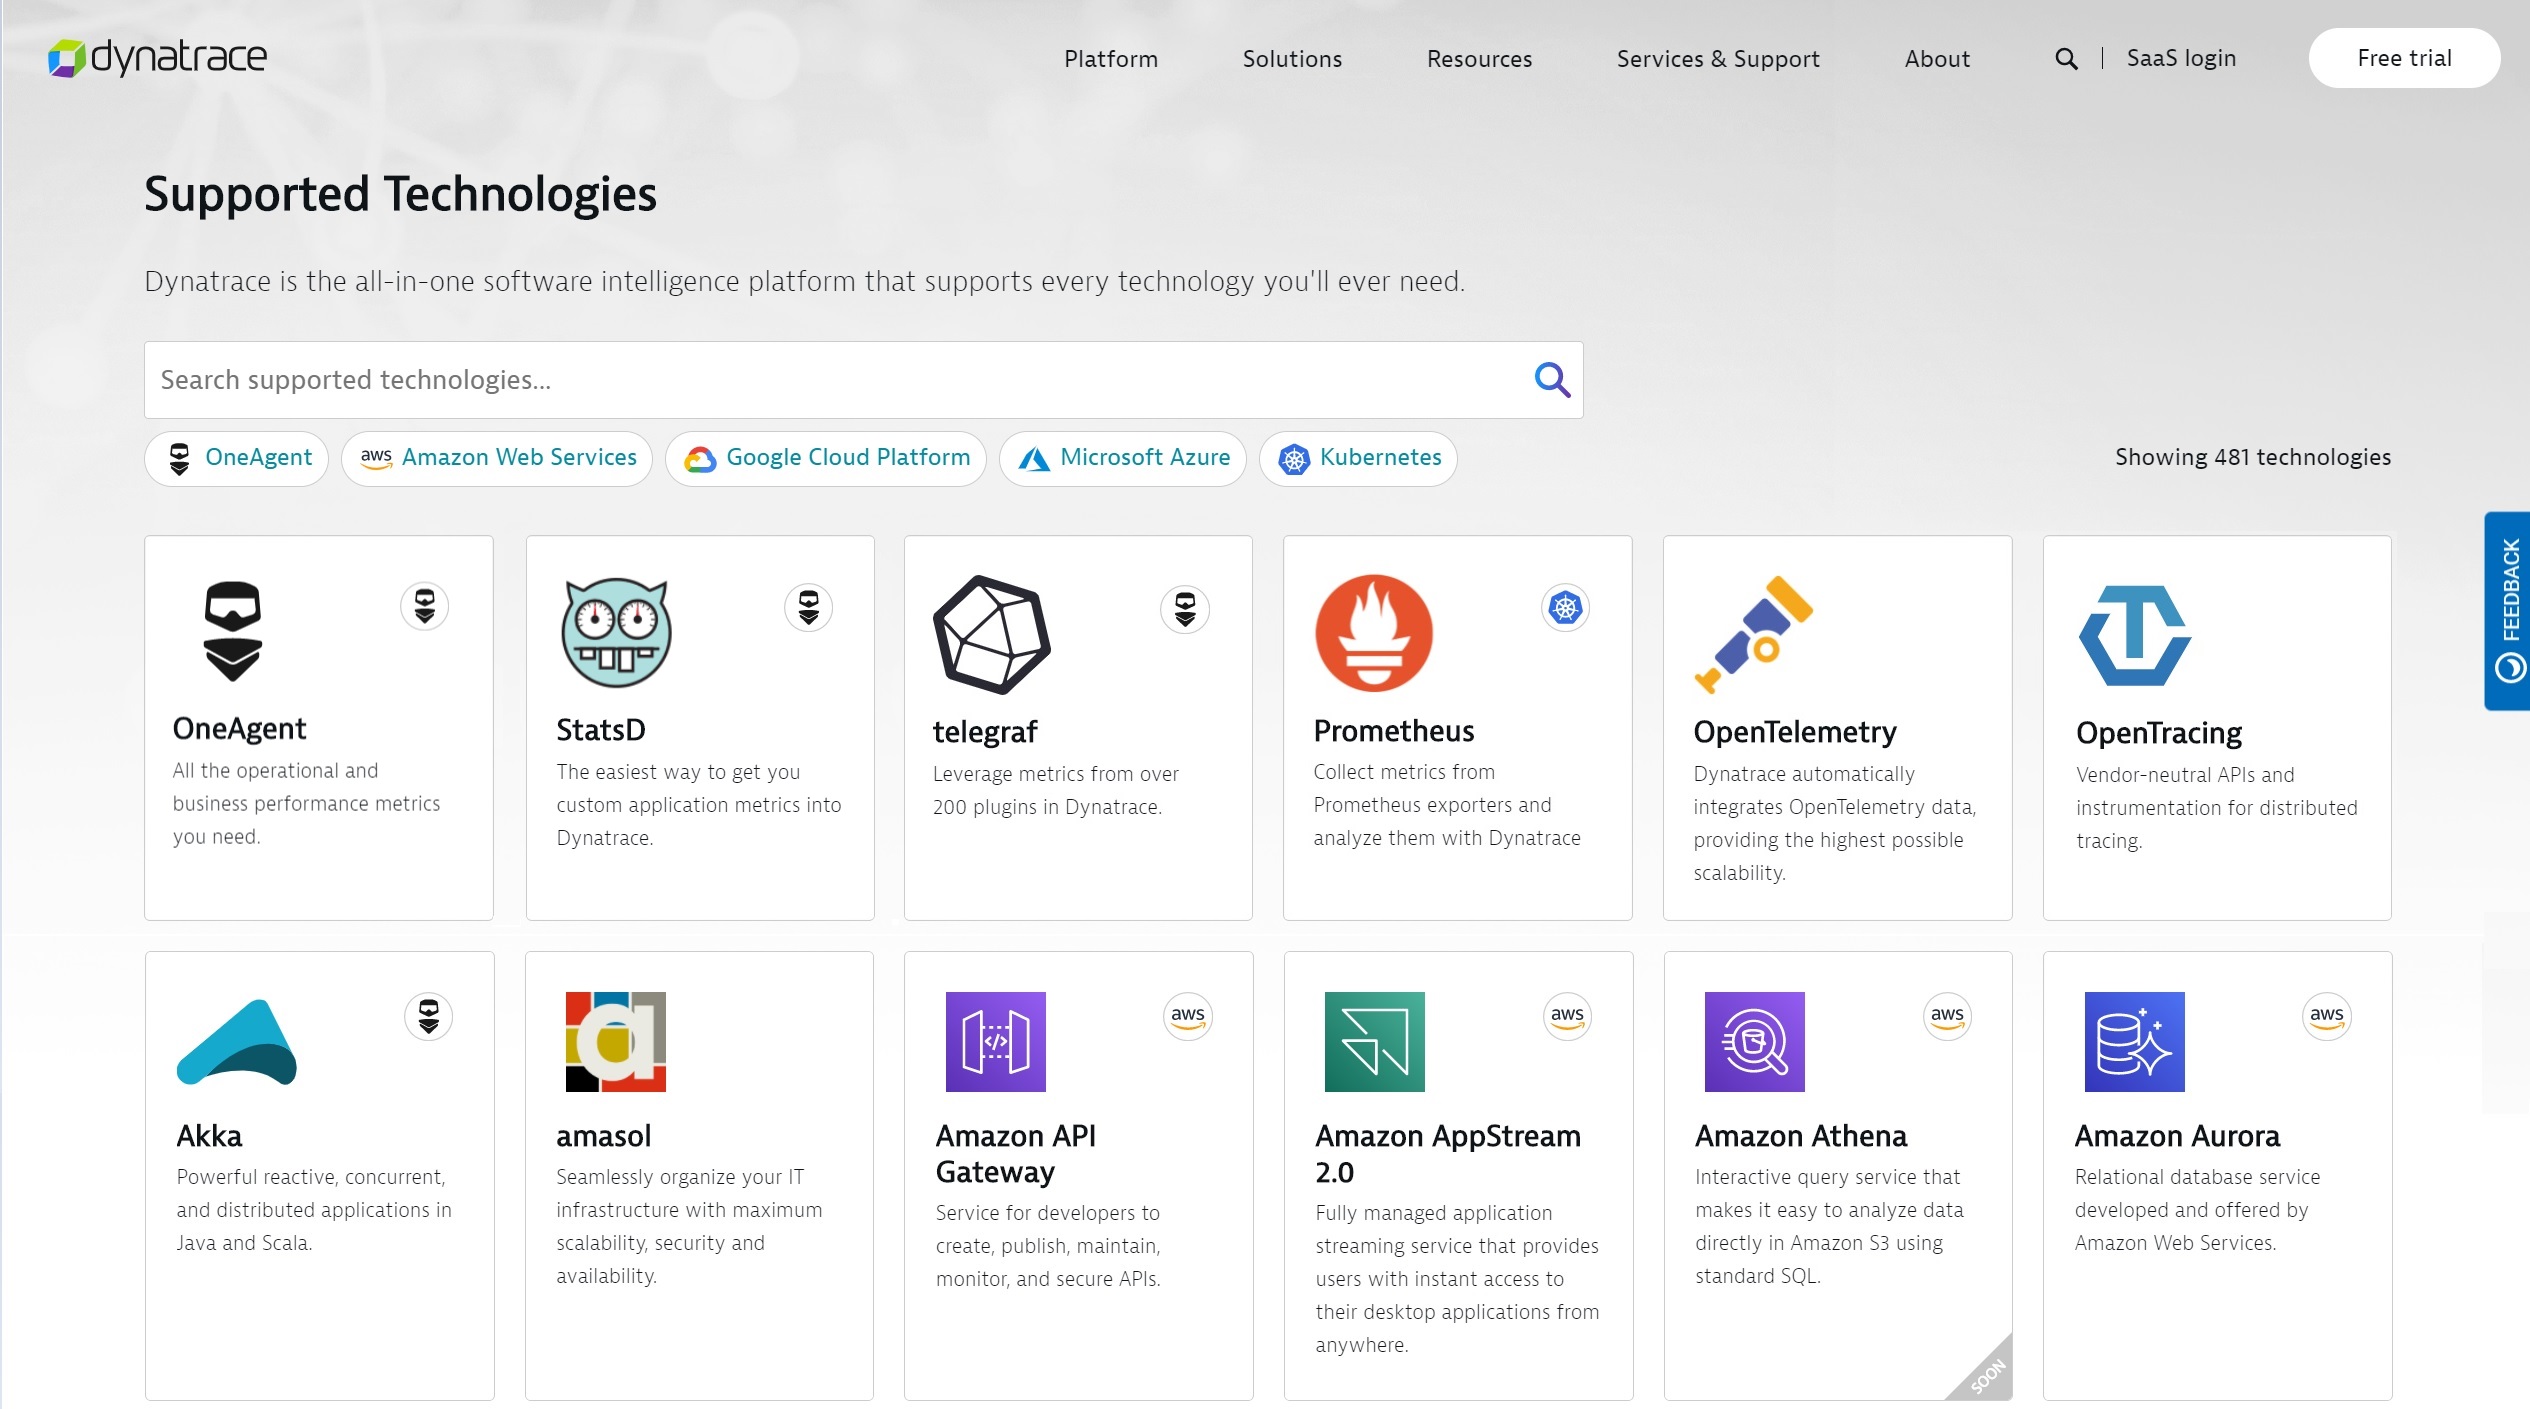
Dynatrace unlocks over 200 new technology integrations
Here’s a quick overview of what you can achieve now that the Dynatrace Software Intelligence Platform has been extended to ingest third-party metrics. Stay tuned for an upcoming blog series where we’ll give you a more hands-on walkthrough of how to ingest any kind of data from StatsD, Telegraf, Prometheus, scripting languages, or our integrated REST API.
Davis AI analyzes your StatsD metrics
StatsD is a widely adopted metric protocol for collecting, aggregating, and sending developer-defined application metrics to separate systems for graphical analysis.
With our new DynatraceStatsD protocol, Dynatrace OneAgent now speaks StatsD and provides you with a vendor-neutral means of bringing existing metric sources into the Dynatrace platform. In addition, Dynatrace fully integrates these metrics into Smartscape. So you get auto-adaptive baselining for custom metrics and Davis automated root cause analysis from Day 1. In this way, Dynatrace brings AIOps to StatsD.
- Read more about how you can simplify observability for your StatsD metrics
Multidimensional analysis for external metrics ingested via secure local REST API
While the StatsD protocol is simple and widely used, it’s not right for all organizations. For example, StatsD doesn’t support dimensions and tagging. Many metric libraries today like Spring micrometer, Dropwizard, or OpenMetrics support such tags, which aren’t supported by StatsD.
To solve this, we’ve added a new line protocol-based REST API to OneAgent to support fully multidimensional metrics that take full advantage of Dynatrace Smartscape. Once you send metrics via the OneAgent REST API, the relevant hosts are automatically enriched with all available monitoring dimensions. As this approach is HTTP-based, you can use it anywhere. And because this is part of OneAgent, you don’t have to concern yourself with scale, encryption, firewalls, or even where your metrics should be sent for analysis—OneAgent takes care of all this for you.
This functionality is most useful to application owners who need to integrate actionable performance and business metrics into the Dynatrace Software Intelligence Platform.
- Read more about how you can run multidimensional analysis for external metrics ingested via secure local REST API
Ingest and analyze metrics from scripting languages like Bash and PowerShell via a simple line protocol
StatsD and the REST API are both well suited for integrations into applications or existing backend services. However, site reliability engineers and operations teams are often interested in metrics that are readily available via command line tools, and they want to monitor these metrics via Bash or other scripting languages like PowerShell or Cronjob.
You can now use the Dynatrace scripting integration to ingest and analyze metrics from such sources. Because the integration uses the same mechanisms as described for REST and StatsD, you can use it to chart all metrics in the same place, including all newly introduced metric dimensions. Our scripting integration uses the same line protocol as the REST API and is thus fully multidimensional and Smartscape-aware.
With this functionality at their fingertips, site reliability engineers and operation teams can now leverage their existing knowledge and toolsets in combination with Dynatrace. These teams know exactly what they need to run their applications and services, but they also need to be able to do more with less. Dynatrace automates the crucial step of observing and analyzing the incoming data points. This means that site reliability engineers and operation teams can analyze ever more data with less effort than before.
- Read more about how you can ingest and analyze metrics from scripting languages
Automatically analyze hundreds of Telegraf-provided data and get precise answers
Telegraf is an open-source agent by Influxdata. Telegraf is a plugin-based system for collecting, processing, aggregating, and writing metrics.
Because Telegraf is solely concerned with getting data into the right form and sending it somewhere, customers need an easy means of analyzing the data mess and gaining actionable insights from Telegraf, in real time. This is the job of the Dynatrace platform.
By adding Dynatrace support to Telegraf, you now get intelligent observability and automatic root cause analysis into over 200 technologies. Your data is analyzed in context with all other sources that are supported by the Dynatrace platform and OneAgent. This means that you’ll automatically see how everything is connected—the relationships and interdependencies between each layer, component, and bit of code in your application environment. To this end, Dynatrace is now available as an output plugin on the backend.
All you need to do is install Telegraf alongside Dynatrace OneAgent and enable the new Dynatrace output plugin. In this way you can easily add 200 additional plugins to your data analysis.
- Read more about how you can automatically analyze hundreds of Telegraf-provided metrics and get precise answers
Scalable and easy Prometheus support for Kubernetes
Prometheus is now the dominant metric provider and sink in the Kubernetes space. Yet many customers struggle with the vast amount of data that Prometheus provides, both in terms of scaling the Prometheus infrastructure as well as producing and maintaining its value. After all, the goal is not the data itself; the goals are the observability that data brings, the alerts it produces, and the answers it can reveal.
Dynatrace now provides a direct solution for this challenge. By directly and automatically feeding Prometheus data from metric exporters, Dynatrace solves the scalability problem. Not only does Dynatrace not place strain on Prometheus servers, Dynatrace itself doesn’t need the servers to produce value for metrics that are ingested from all backing services or applications you run in Kubernetes. What’s more, Dynatrace embeds Kubernetes pods into the larger context of the environment and thus puts Prometheus metrics into context, allowing you to focus on what matters, getting the answers and alerts you need for your applications and backing services without needing to maintain hundreds of different alert configurations or constantly adapting the monitoring solution to the ever-changing topology of the applications running inside Kubernetes.
- Read more about how you can easily unlock the power of Prometheus metrics with Dynatrace
Automatic and intelligent observability with OpenTelemetry Metrics support for your Go applications
OpenTelemetry is everywhere these days and mostly people talk about it’s support for distributed tracing, yet many customers use it to expose metrics within their applications. Dynatrace is working on an OpenTelemetry metrics exporter which will automatically tap into metrics exposed via OpenTelemetry instrumentation to send the telemetry data to the Dynatrace analytics engine. Stay tuned.
Summary
Dynatrace not only monitors everything from hosts to clouds, it’s designed around the pillars of observability: traces, metrics, events, and logs. Dynatrace is unique in that it combines metric ingestion with automatic topology detection across all your hosts, processes, services, pods, containers, clouds, and more. All in real time.
Dynatrace OneAgent now provides this value in a seamless automatic and secure integration with StatsD and Telegraf metrics. With the addition of a secure local REST API, we’ll soon bring this to other open-source metric providers like Spring Micrometer or OpenTelemetry metrics.
Dynatrace understands dependencies, traffic, and transaction flows and how they change over time. Our deterministic AI provides impact and root cause for any problem that arises, not just simple alerts. By embracing open source technologies we’re also opening up our Smartscape topology and Davis AI engines to you so that you can take full advantage of Dynatrace analytics for all sources of data. New to Dynatrace? Try it out by entering our free trial today. Already a customer? Go into your account and experience how Dynatrace can help you get the best out of your Prometheus and StatsD investment.
Seeing is believing
What’s next
We’ll add Dynatrace support to additional open source frameworks. Next in line is Spring micrometer, which already has Dynatrace support. We’ll enhance it so that it takes full advantage of our built-in OneAgent multidimensional metric API.


Looking for answers?
Start a new discussion or ask for help in our Q&A forum.
Go to forum