
The challenge with ASP.NET Web Service Observability, Diagnostics, and Performance Optimization is that most monitoring & diagnostic tools only provide global Service Level Indicators metrics (SLIs) such as response time, failure rate, and throughput, but not metrics for each individual service endpoint. The reason for this is because a classical ASP.NET SOAP Web Service (ASMX) exposes its individual endpoints through the same URL and using the SoapAction HTTP Header to determine which method to execute and therefore most tools only report on the global service name.
The same default behavior is also true for Dynatrace when installing the OneAgent on your servers that host your ASP.NET services. Once installed, every single web service request processed by ASP.NET will be traced across all tiers and captured as a PurePath (Distributed Trace). The screenshot below shows a PurePath that was shared with me by our partner triscon from Vienna, which specializes in Load and Performance testing for large enterprise applications. During a recent project, they immediately found long-running transactions that made several web services calls where one took more than 4 seconds. While this is great information the PurePath left some questions open:
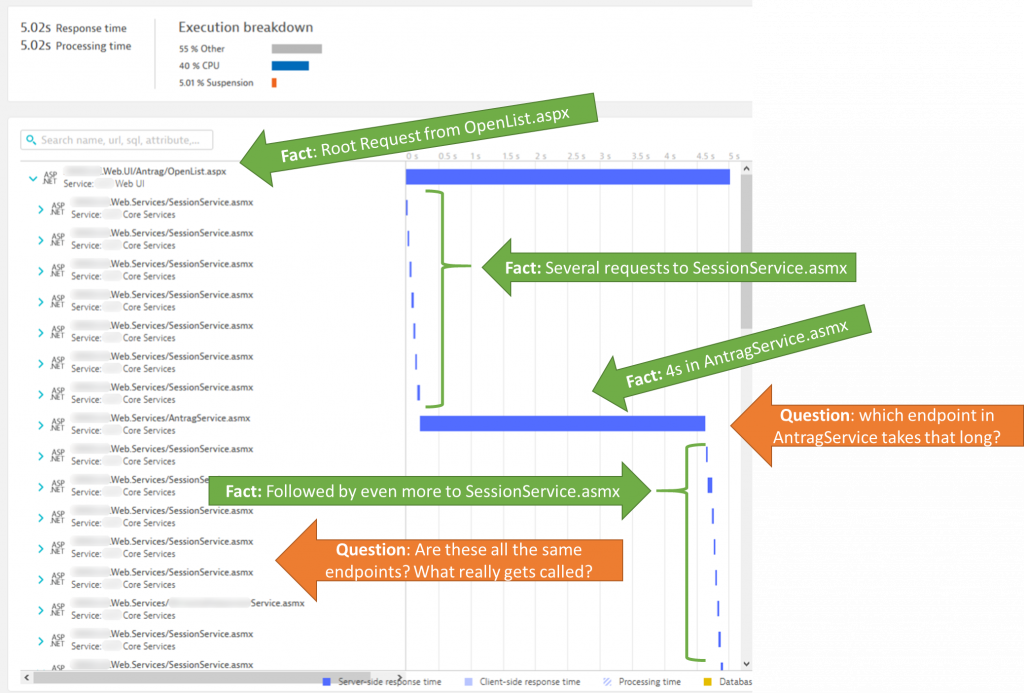
What triscon really needed was not just PurePaths showing many calls to the same service instance. To monitor SLIs and optimize Service Level Objectives (SLOs) down to individual web service endpoints, the additional context from the soapaction header was required.
Additional context without code change through request attributes
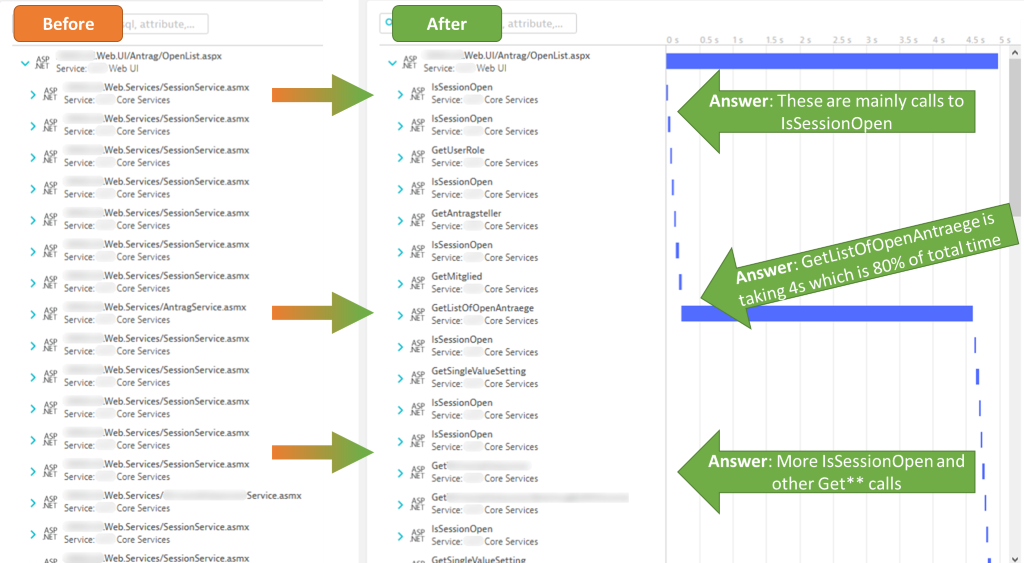
In order to get the required additional context to detect service endpoints triscon leveraged Dynatrace’s Request Attributes, which enables users to extract additional context, such as service method name, for each distributed trace without the need for actual code modification. The data can be extracted from HTTP request or response headers, method arguments, return values, and more. Having this additional context as part of the PurePath speeds up the analysis and diagnostics work for performance engineers, developers, or architects. Below are before and after screenshots of the same PurePath shown above.
While this additional context information is great for engineers when analyzing individual traces, it can be used for multi-dimensional analysis across all captured PurePaths during a test or even in production to answer much bigger questions.
Diagnosing architectural issues in (micro)service architectures
As I said, the ability to analyze individual PurePaths down to code level is a great capability. However – it’s not the approach that allows us to quickly identify performance or architectural hotspots in your distributed application. Why? Because nobody has the time to analyze billions of distributed traces that get collected in a performance or production environment. This is where the strength of Dynatrace comes in, as it automates the analysis of all captured PurePaths and allows us to phrase questions that really matter – such as: “Do we have service methods that make excessive database calls? And if they exist – how we can optimize this behavior?” – or – “My critical SLIs are response time, failure rate and throughput per service endpoint: can you give me that data?”
These are some of the questions triscon asked for all of their projects and the answer comes through Dynatrace’s Multidimensional Analysis View:
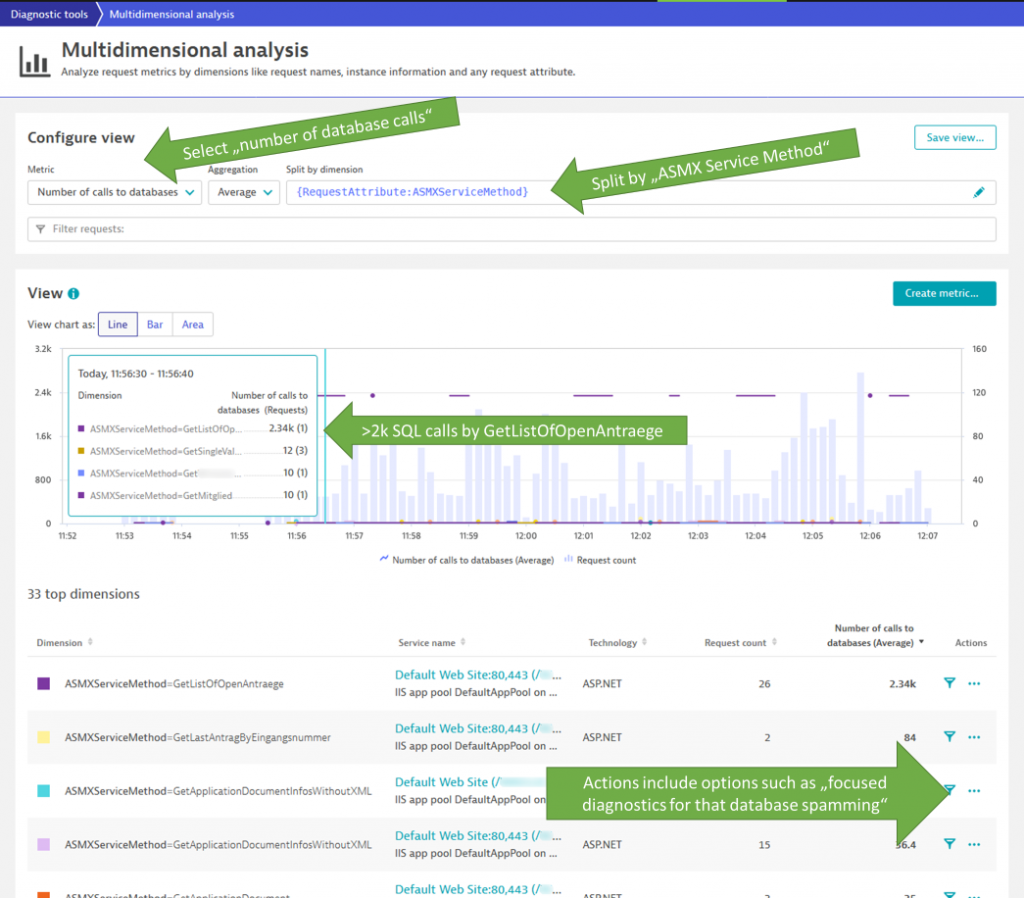
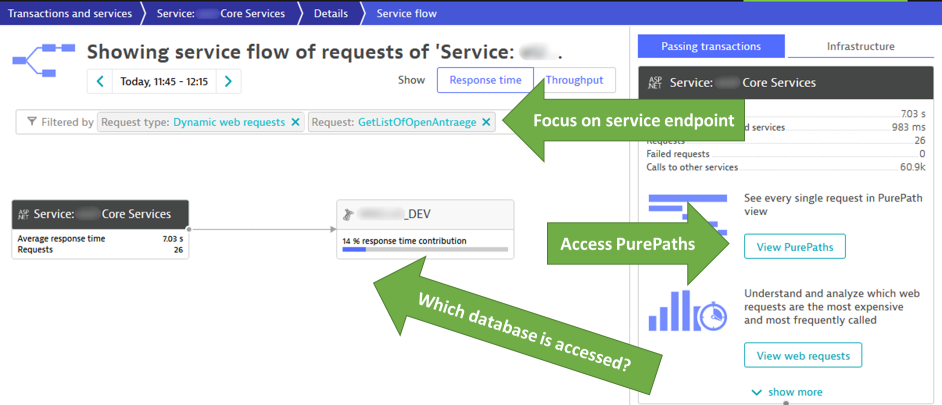
From this view it’s just a single click to more details such as database hotspots, method hotspots, PurePaths or Service Flow:
The multi-dimensional analysis view is also your starting point to define your important SLIs, e.g. Response time, failure rate or throughput split by service endpoint name. If you want to learn more check out the blog from Michael Kopp on Analyze microservice-based metrics without code changes or watch my YouTube Tutorial on Calculated Service Metrics.
If you have your own web services and aren’t happy with your current approach of observability, diagnostics, and performance optimization then follow the next steps.
How to enable this for your web service?
It all starts with installing the Dynatrace OneAgent on your environment. If you don’t yet have Dynatrace – simply get download a Dynatrace Trial. Once you have Dynatrace capturing data from your apps and services simple follow these best practices shared by our friends from triscon so you can get even more out of Dynatrace.
Step 1: Identify the context data
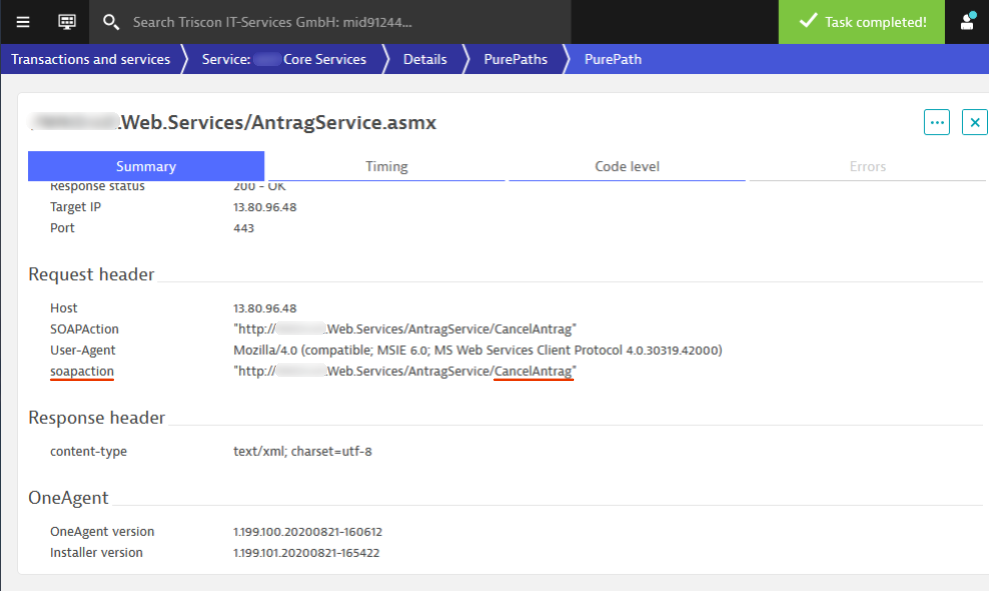
In the case of ASP.NET Web Services (ASMX) the information about the actual service method is passed as part of the soapaction HTTP Header. Dynatrace allows you to capture any HTTP Header as well as other context information such as method arguments, return values, cookies, messaging information and more.
Triscon’s first attempt was to capture the full soapaction header to learn about the format of the value. Once configured as a Request Attribute this value will show up on each captured PurePath like shown in the following screenshot:
Step 2: Define Request Attributes
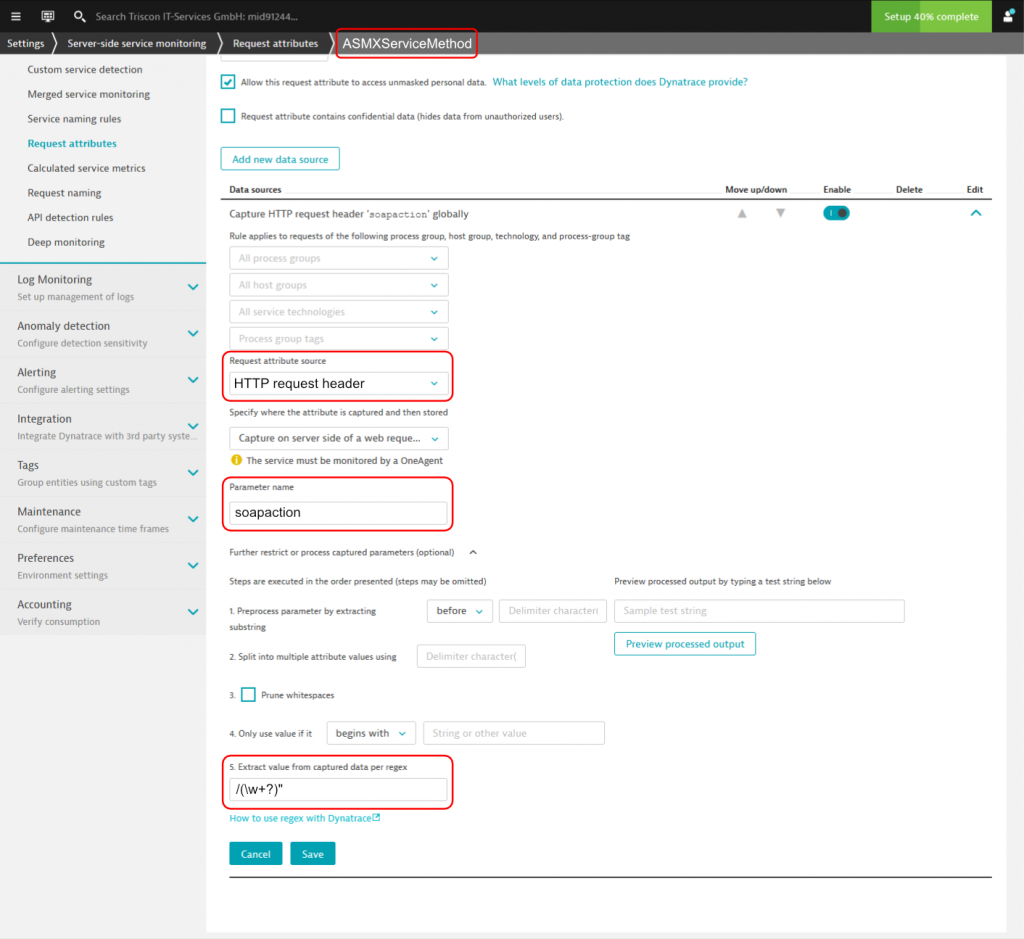
Looking at the soapaction value it’s apparent that the important piece is the last part of the URL. Luckily Dynatrace Request Attributes allow you to specify a regular expression to parse out the piece of information you really want Dynatrace to extract and make available for diagnostics. Here is a screenshot that shows the final Request Attribute configuration:
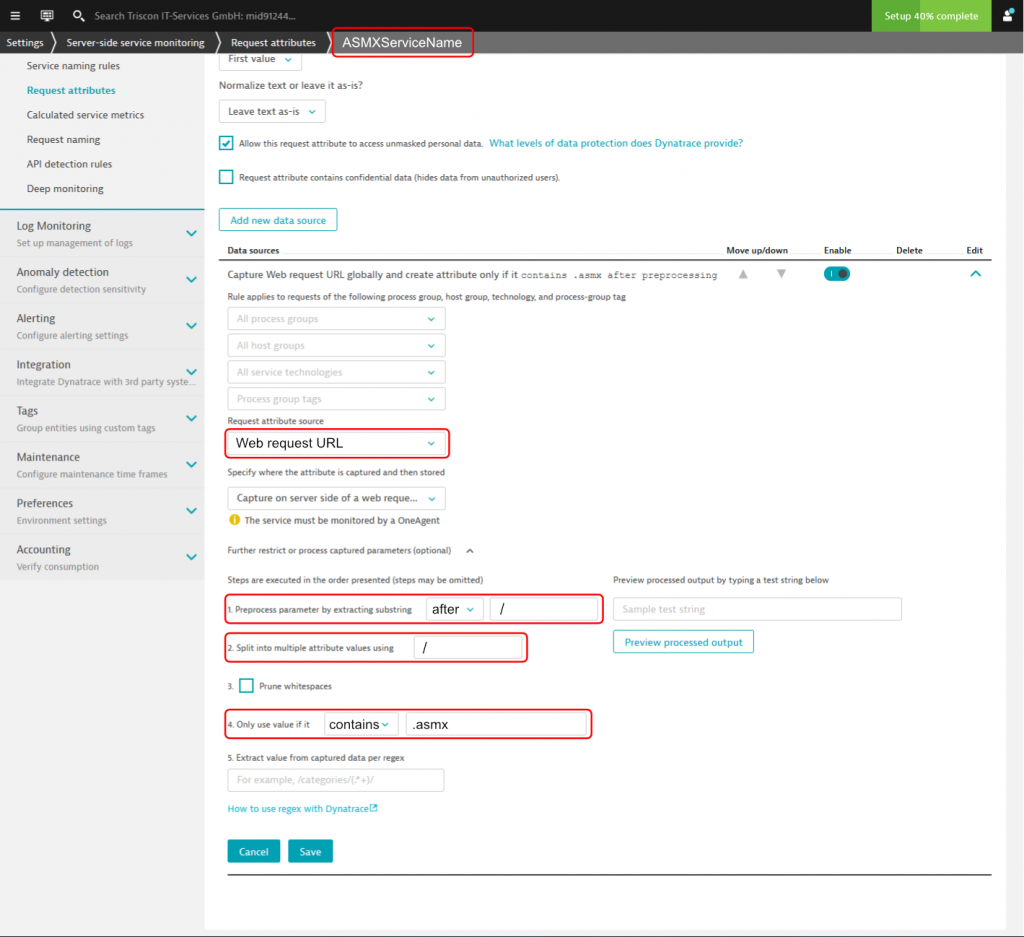
In addition to the service method name, triscon also suggests defining a second request attribute for the name of the entire web service which is part of the URL. Here’s the configuration for that request attribute:
Request attributes can be used for multi-dimensional analysis as shown earlier in the blog. But there is more use you see in the next step.
Step 3: Request naming rules
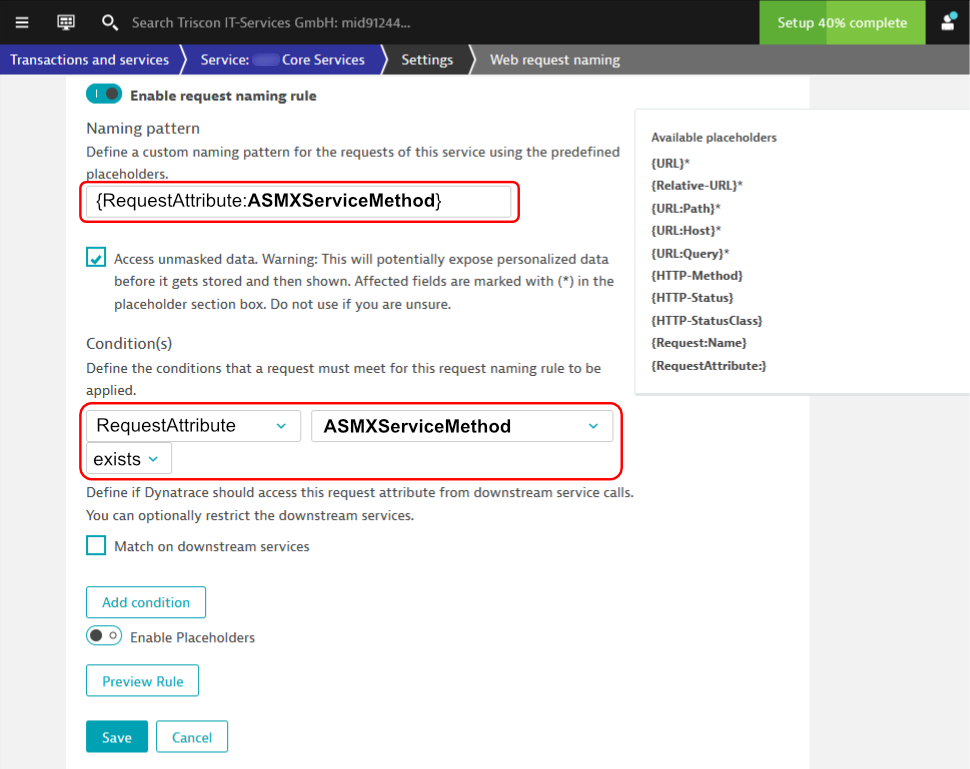
Do you remember the before & after PurePath picture from the beginning? It showed the proper ASMX Service Name and the ASMX Service Method Name as part of the PurePath names. This is possible because Dynatrace allows us to define custom naming rules for PurePaths. The following shows the request naming rule configuration which we should add to our best practices for ASP.NET Web Service monitoring:
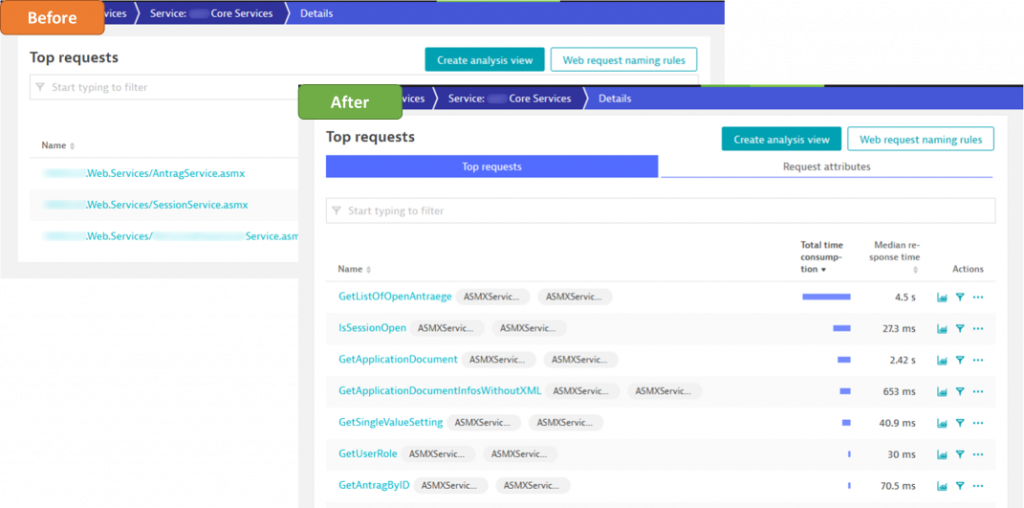
Once configured these names are the official PurePath request names like shown in the top requests view when analyzing an individual service. Here is another before/after comparison that clearly shows how valuable this additional context is:
Get started with your own web service monitoring
While Dynatrace gives you a lot of out of the box data and context we can easily extend it with more context needed for better monitoring, diagnostics, and performance optimizations on frameworks such as ASP.NET Web Services.
Thanks again to our partner triscon who is not holding these best practices back but sharing it with the larger community. If you want to learn more from triscon watch out for their upcoming presentations at Neotys PAC where they talk about performance automation with Neotys, Dynatrace & Keptn. I am sure I will also invite them soon to one of my performance clinics and other events where these practices should be shared.


Looking for answers?
Start a new discussion or ask for help in our Q&A forum.
Go to forum