
Everyone is doing HTTP error monitoring these days. The question is, are you doing it the right way? If you think your web server logs are showing you all your HTTP errors, you're probably wrong. You're likely missing a lot.
Modern web applications rely heavily on Content Delivery Networks (CDNs) and 3rd-party integrations (for example, web analytics, tag managers, chat bots, A/B testing tools, ad providers, and more). Such web resources have two things in common:
- Their requests never hit your data center, hence any failed requests don’t show up in your web server logs
- Their performance and any errors they cause can have a massive impact on your bottom line
In this two-part blog series you’ll learn how to easily handle the monitoring challenges posed by Content Delivery Networks (CDNs) and 3rd-party integrations. In Part 1 we’ll dive into:
- The need to extend synthetic tests to cope with the CDN-error blind spot
- How to analyze issues with enhanced Dynatrace HTTP error monitoring and troubleshooting
- How to fix HTTP errors in three easy steps using Dynatrace
The need to extend synthetic tests to cope with the CDN-error blind spot
You might be using a CDN for multiple purposes, but the main purpose is to deliver content from locations that are close to your users to ensure better performance and improve user experience. For years, Dynatrace has ensured that CDNs perform as expected by using our Synthetic Monitoring solution. This has been a best practice for a long time, and some still see it as the best option.
The problem with this approach is that you need to cover many different locations and, for all of them, you need to have a high test frequency to get useful monitoring data. This approach was already at its limit back in 2008 when an Akamai CDN network had only ~25,000 delivery nodes. This was however the only option back then, since Real User Monitoring (RUM) didn’t yet exist. Today, Akamai has ~265,000 delivery nodes. The financial investment required to run an adequate synthetic test set for this many nodes isn’t viable.
So, how can you know if a CDN is delivering HTTP 404 error codes for requests in a specific region? If you’re lucky, your synthetic tests will pick them up. Still, how will you know if it’s not your datacenter that’s causing the issue, but rather the CDN network?
To help you out in this situation, Dynatrace Real User Monitoring has changed the way that HTTP errors are captured and reported.
Analyze issues with enhanced HTTP error monitoring and troubleshooting
In the latest release of Dynatrace, we’ve added a new error workflow that allows you to:
- See and quantify HTTP errors
- Analyze and quantify the end user impact of HTTP errors (improve MTTI)
- Communicate related issues with the details required to fix them quickly (improve MTTR)
The Dynatrace Real User Monitoring solution picks up HTTP errors that occur in the browser and reports them. If you’re using Dynatrace OneAgent to monitor your datacenter, you’ll benefit from the fact that we’ve combined the information so that you can now immediately see if a problem occurs is in your datacenter or in the CDN.
- If Real User Monitoring picks up an error, but OneAgent doesn’t, the issue is with your CDN provider.
- If an issue is in your datacenter, OneAgent will deliver all the insights you need to fix the issue in-house.
How do you like this idea? Ready to delete your Synthetic CDN-related tests? Not so fast. Consider that weaving these strengths with the strengths of Dynatrace Synthetic, namely a clean-room environment and testing outside of business hours, provides even more value.
How to fix HTTP errors in 3 easy steps with Dynatrace
Step 1: Quantify the errors
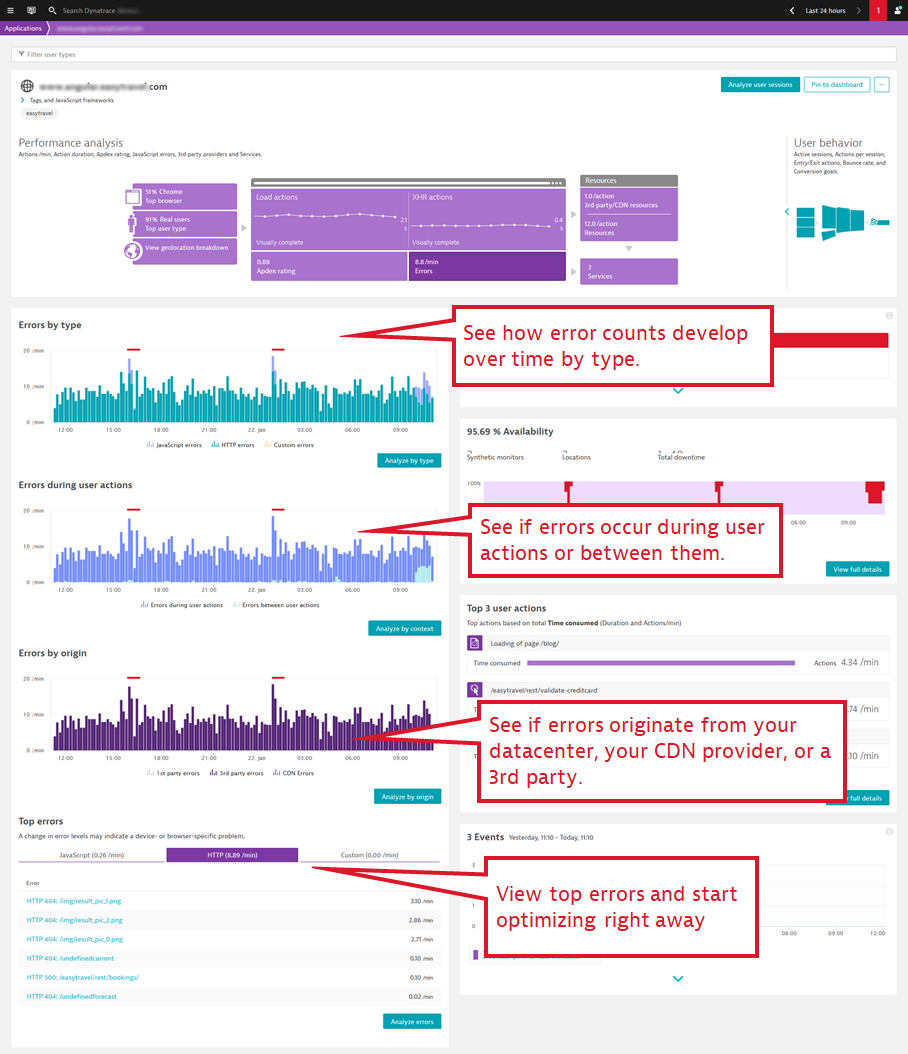
On the application overview page you have an error overview available that shows you the errors of a particular web application over time, split by type, occurrence context, and origin. You can also immediately see the top error list and start optimizing from there.
Step 2: Analyze and quantify end user impact
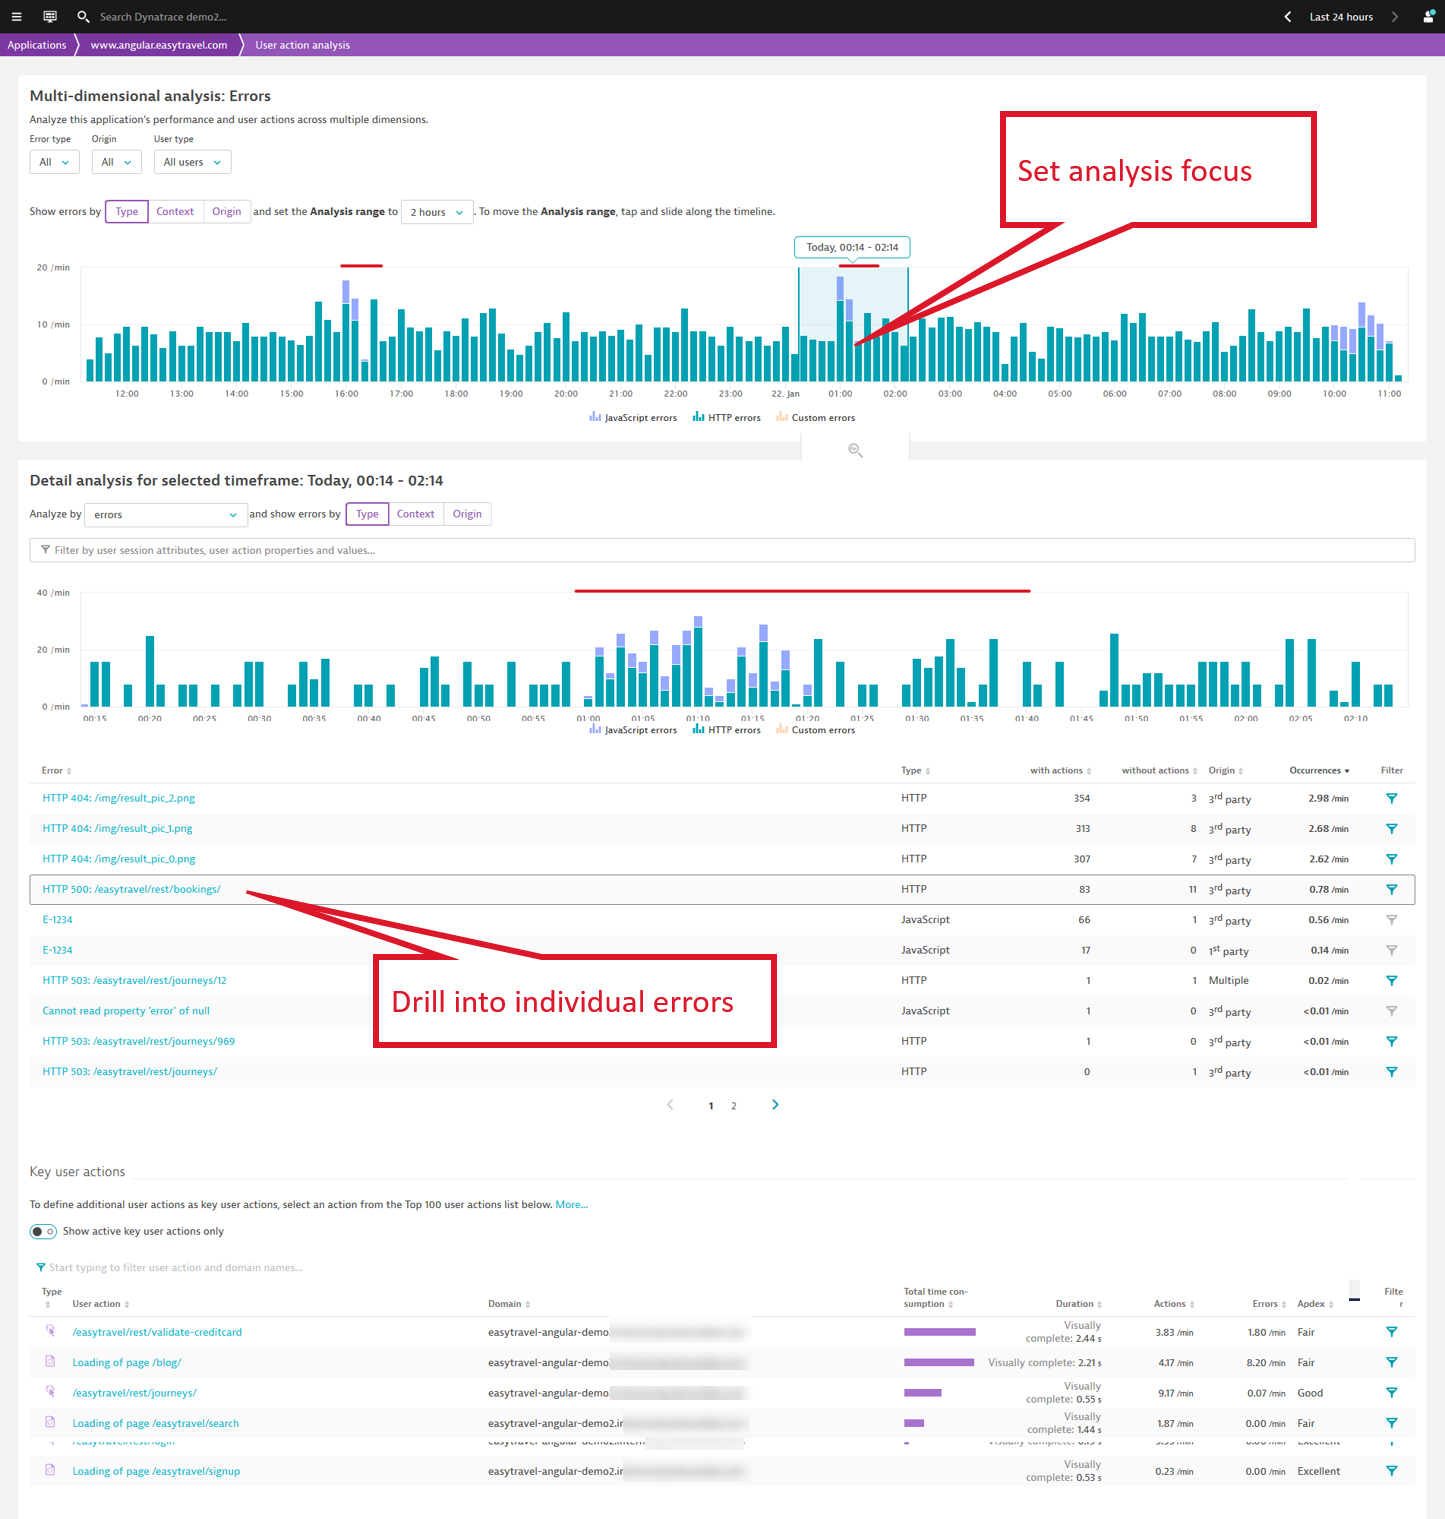
With the first drill down into the multidimensional analysis, you can start focusing on the problem timeframe, as shown below.
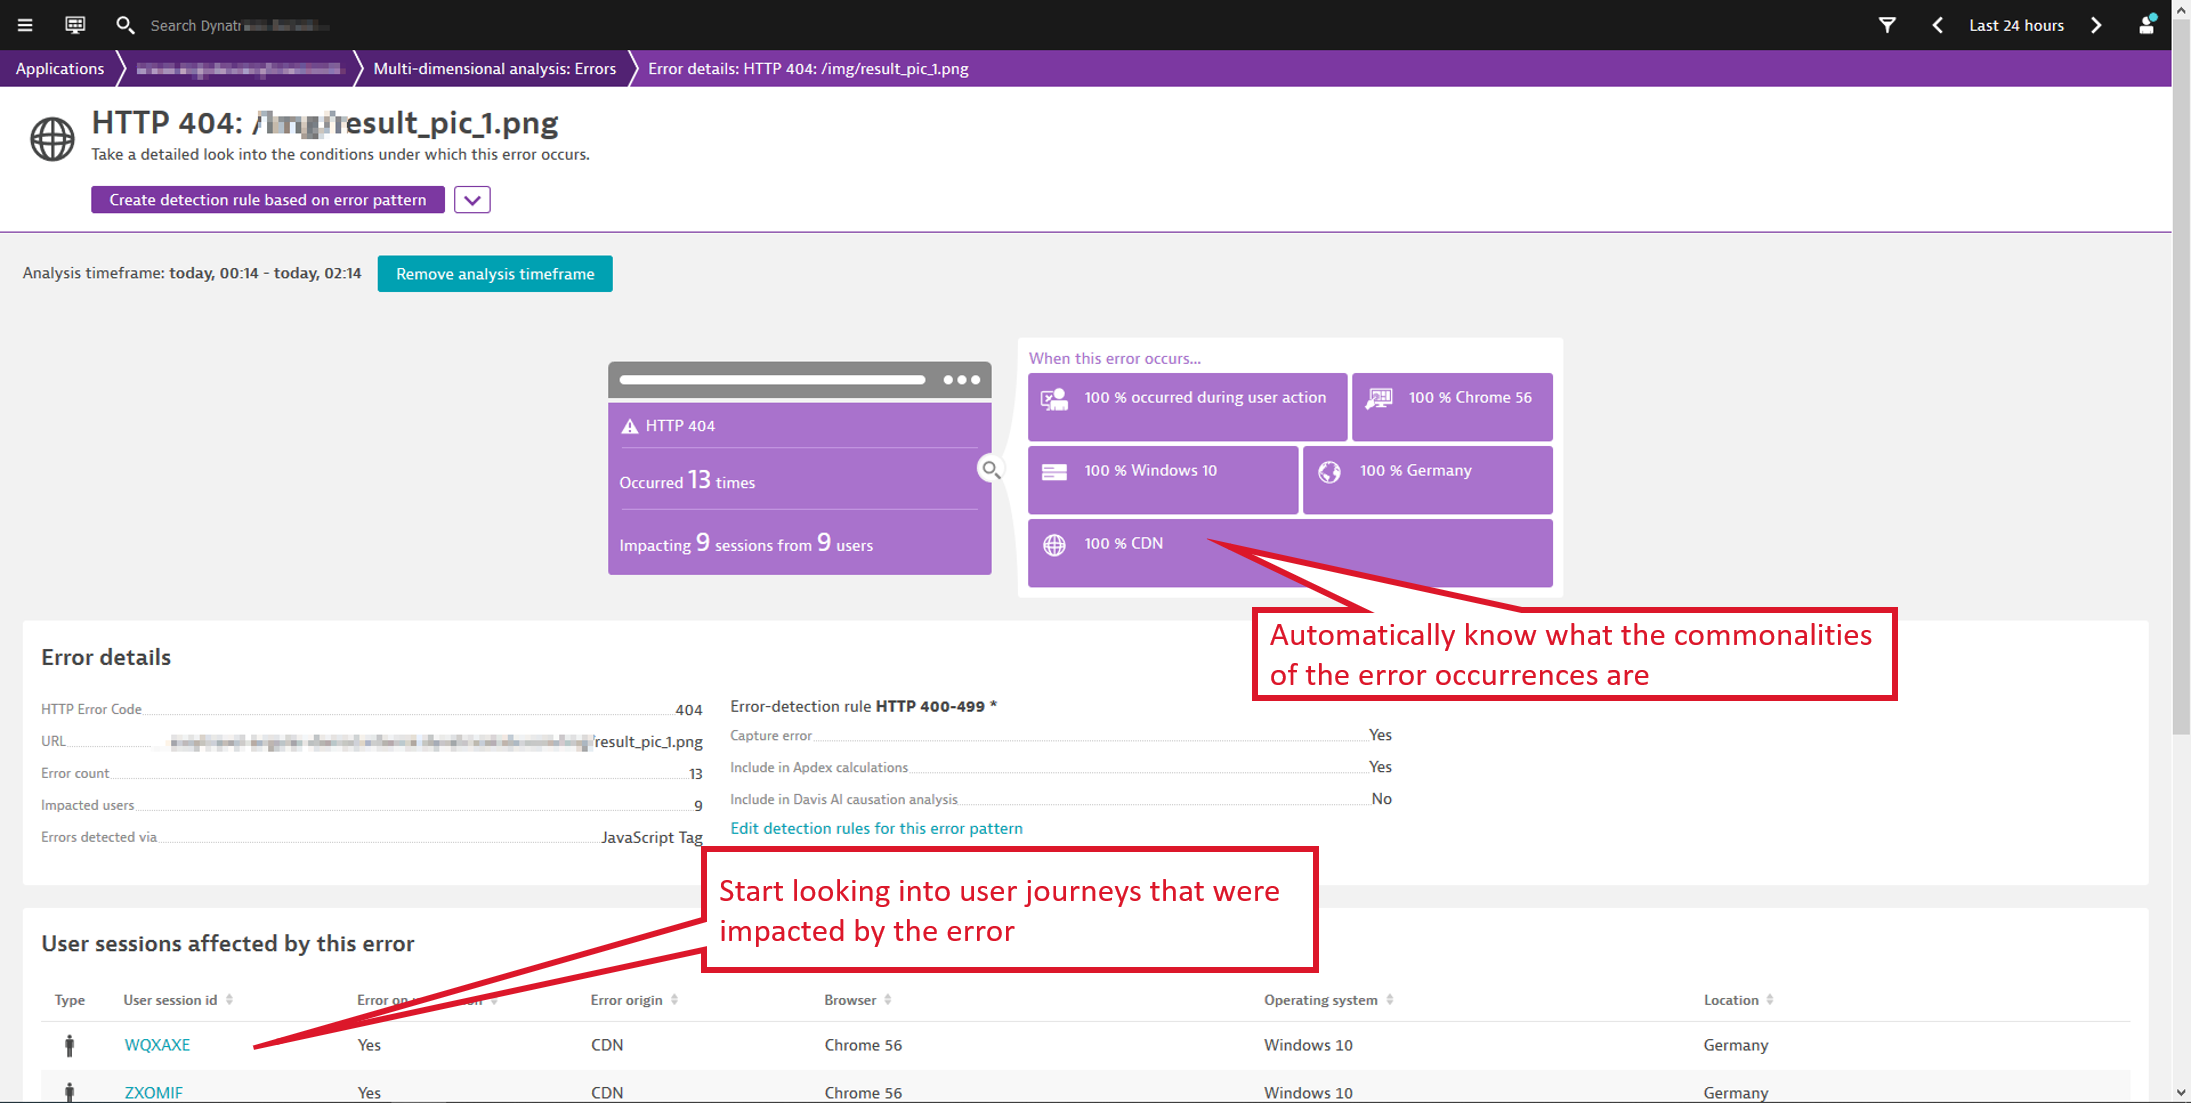
Once you pick a particular error from the top error list on the multidimensional analysis view, Dynatrace gives you immediate insight into the occurrence statistics of the error. The example below shows that this error is caused by a CDN issue that only occurs in Germany.
By investigating one of the user sessions listed, you can learn which steps the user took that led to the error. As shown below, the user went through the steps of booking a trip. Due to the added user session properties, we can see that this user is a Platinum status customer and that $3,999 in potential revenue was lost.
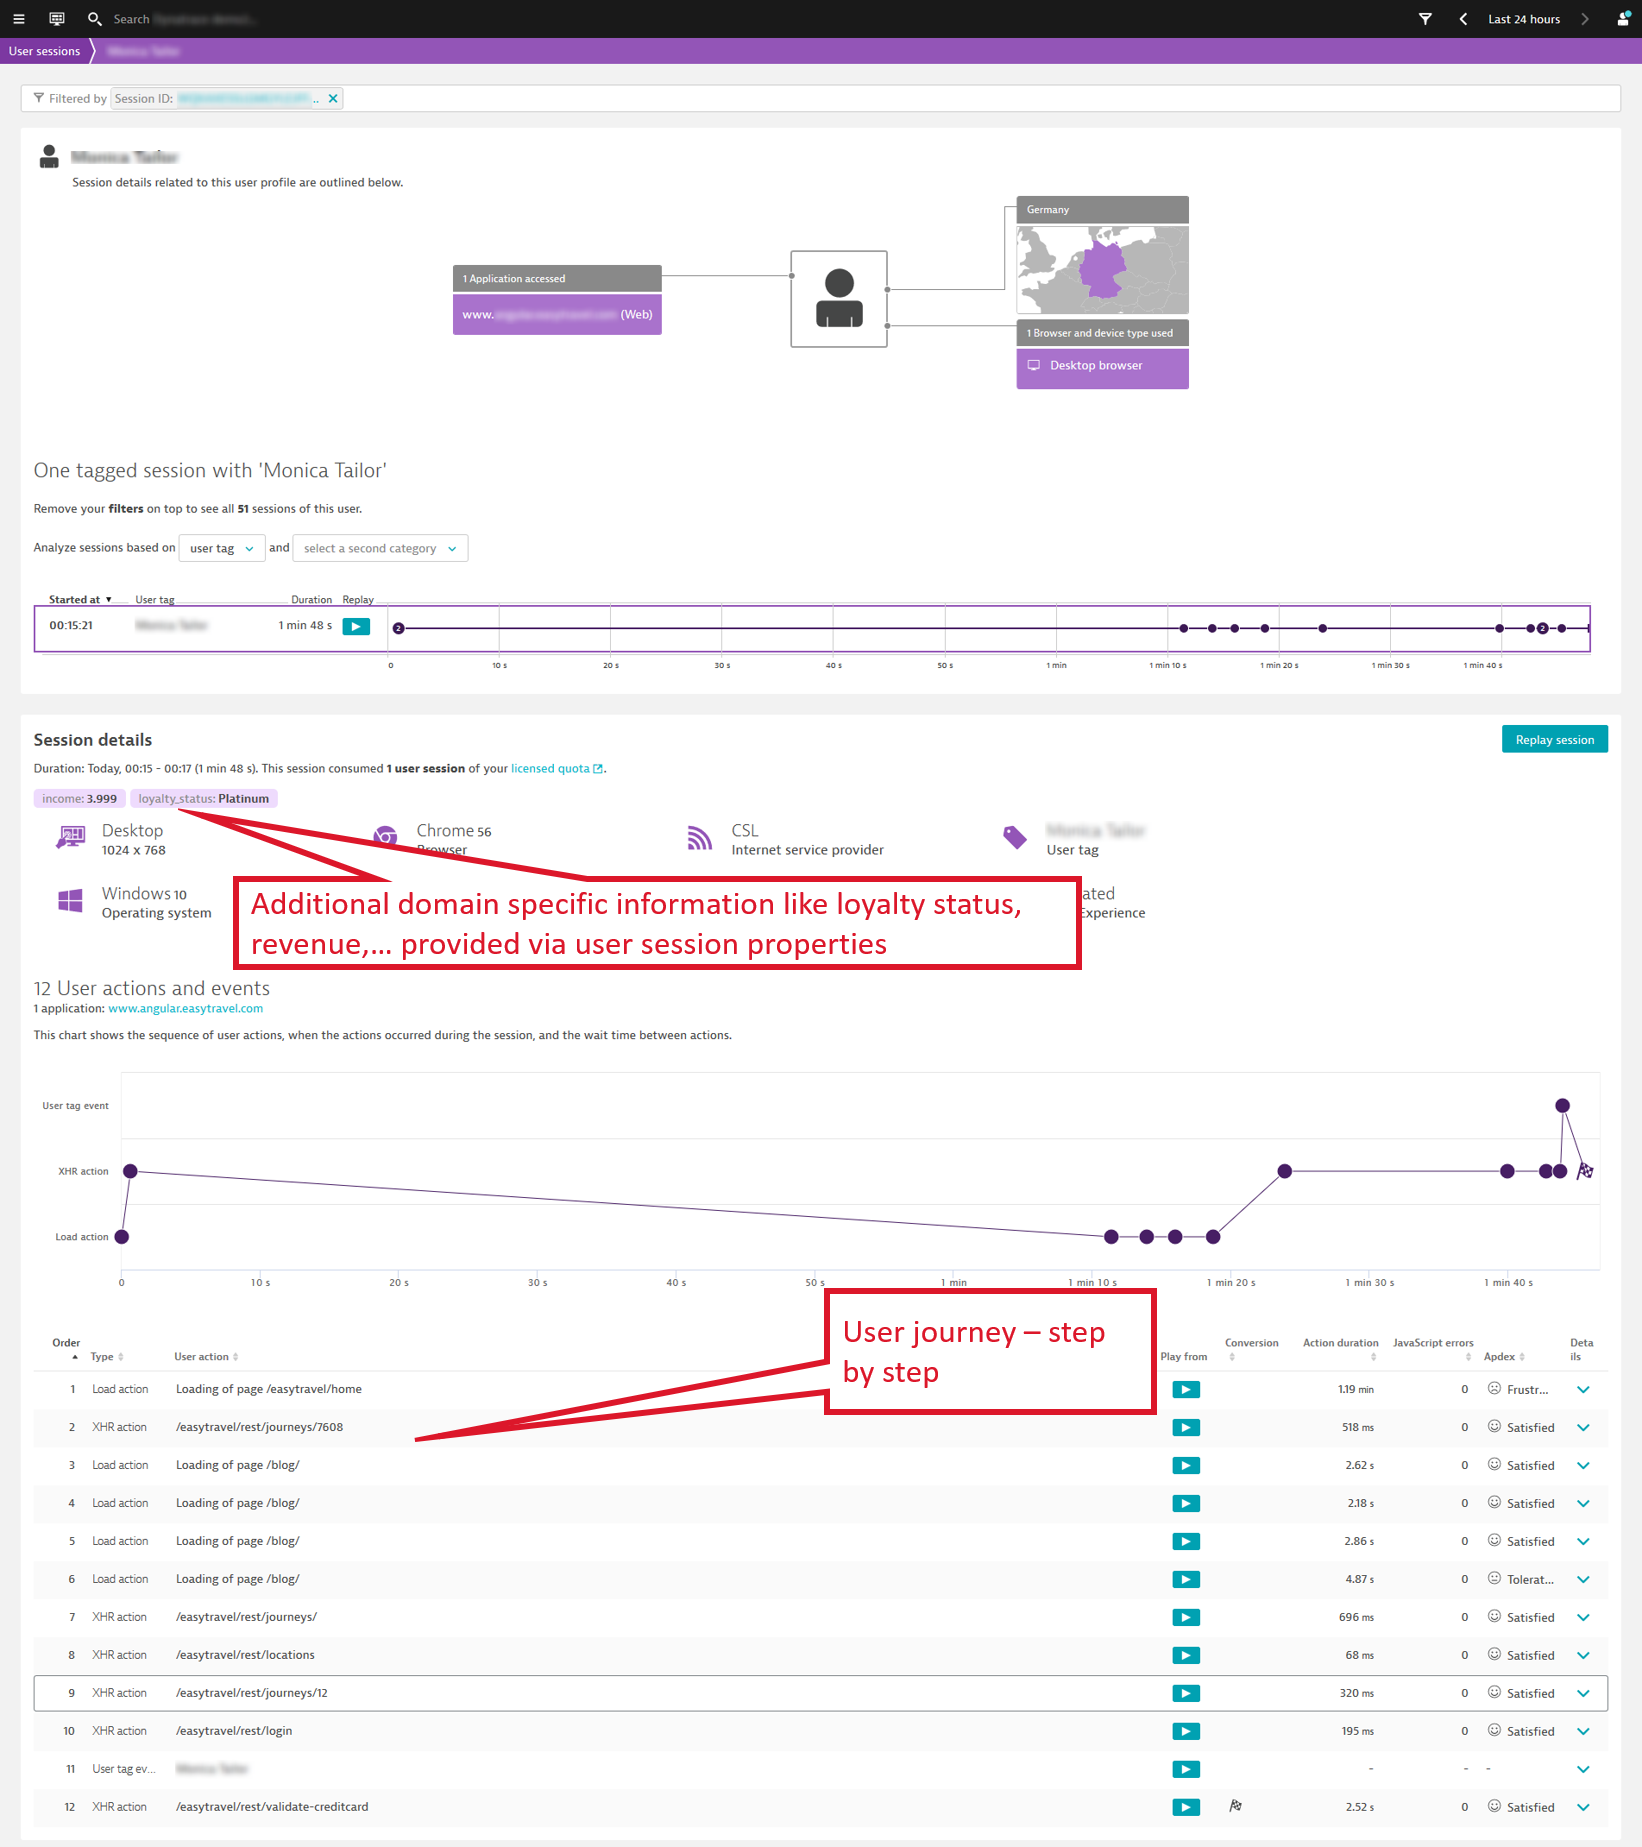
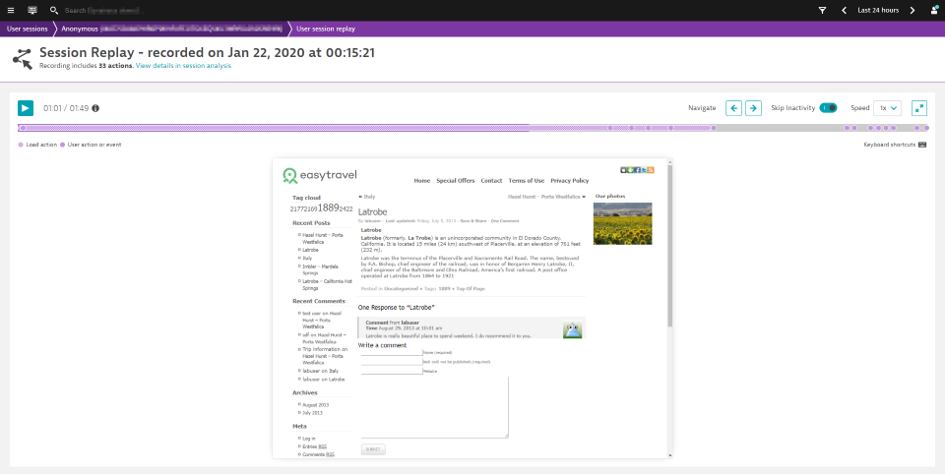
You can also make the error visible since Session replay makes it easy for you to see what the error looked like from the end-user’s perspective.
Step 3: Communicate the issue with the details required to fix it
Without being an expert in the application’s functionality and architecture, you can still learn from step 2 that the impact was not only on the end user, but also on your business’ bottom line. Taking this information to the application owner will enable them to discuss further steps with the CDN provider.
Stay tuned for Part 2
If you enjoyed this post, stay tuned for the follow-up post where we’ll give you a walk-through of how you can get HTTP error visibility into 3rd party tools using Dynatrace RUM. Or, learn more about this new capability by watching this Performance Clinic video.


Looking for answers?
Start a new discussion or ask for help in our Q&A forum.
Go to forum