
With Dynatrace version 188, you get extra visibility into every Kubernetes event exposed by the Kubernetes Events API.
Kubernetes has become the industry standard platform for running and managing containerized workloads at scale. The Kubernetes platform, at its core, is designed to maintain and keep up with a defined state for running workloads. In many cases, events are generated as these workloads go through different phases of their life cycles. For instance, events appear when the scheduler performs actions to bring workloads back to a desired state. Kubernetes also generates events when the state of a node changes, such as an eviction threshold being met and the kubelet attempting to reclaim memory.
For years, OneAgent technology has provided automated full-stack visibility into Kubernetes nodes and the workloads that run there. Now, with the release of Dynatrace version 1.188 and ActiveGate version 1.187, we’re excited to offer extra visibility into every Kubernetes event that’s exposed by the Kubernetes Events API.
Find out why your pods fail with CrashLoopBackOffs
For better or worse, every Kubernetes user learns about the CrashLoopBackOff and ImagePullBackOff events. I remember seeing these events early in 2016 as I was getting my hands dirty with Kubernetes. ImagePullBackOffs are rather easy to understand—the name of the event explains that it’s an image that can’t be pulled from a registry.
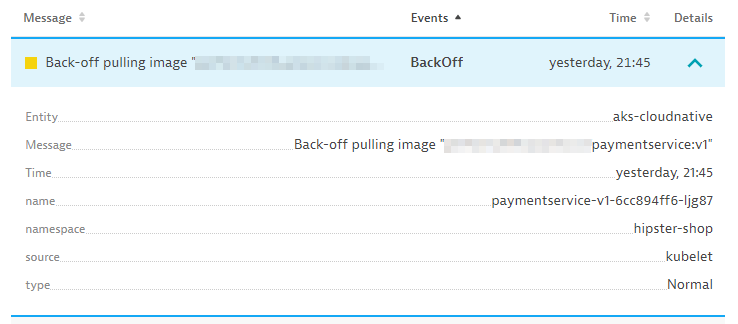
CrashLoop events are created when a pod starts up, runs for a little while, crashes, and then restarts. A restart policy is defined in the pod specification by default. This is used by a kubelet to restart a crashing container with a back-off delay. There are many reasons why containers crash. Often, it’s because an application inside a container crashes. Crashes can also occur when a container or pod is misconfigured.
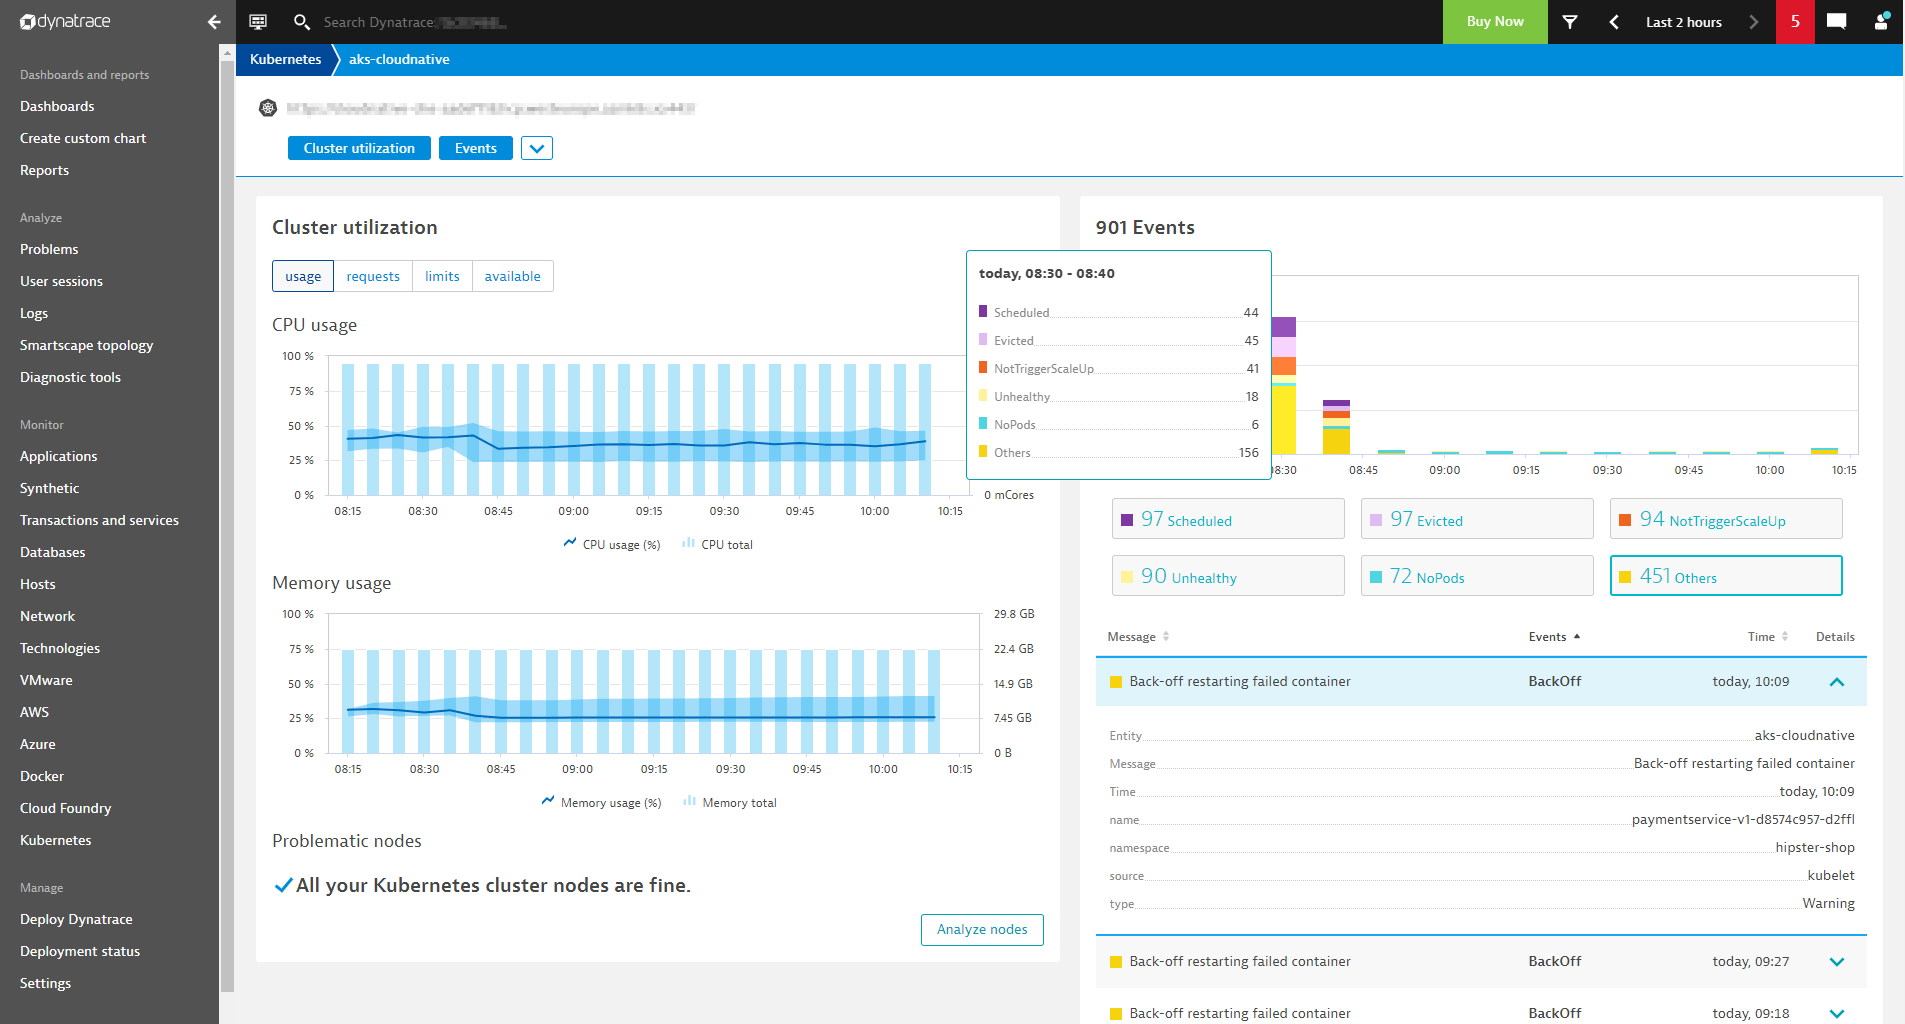
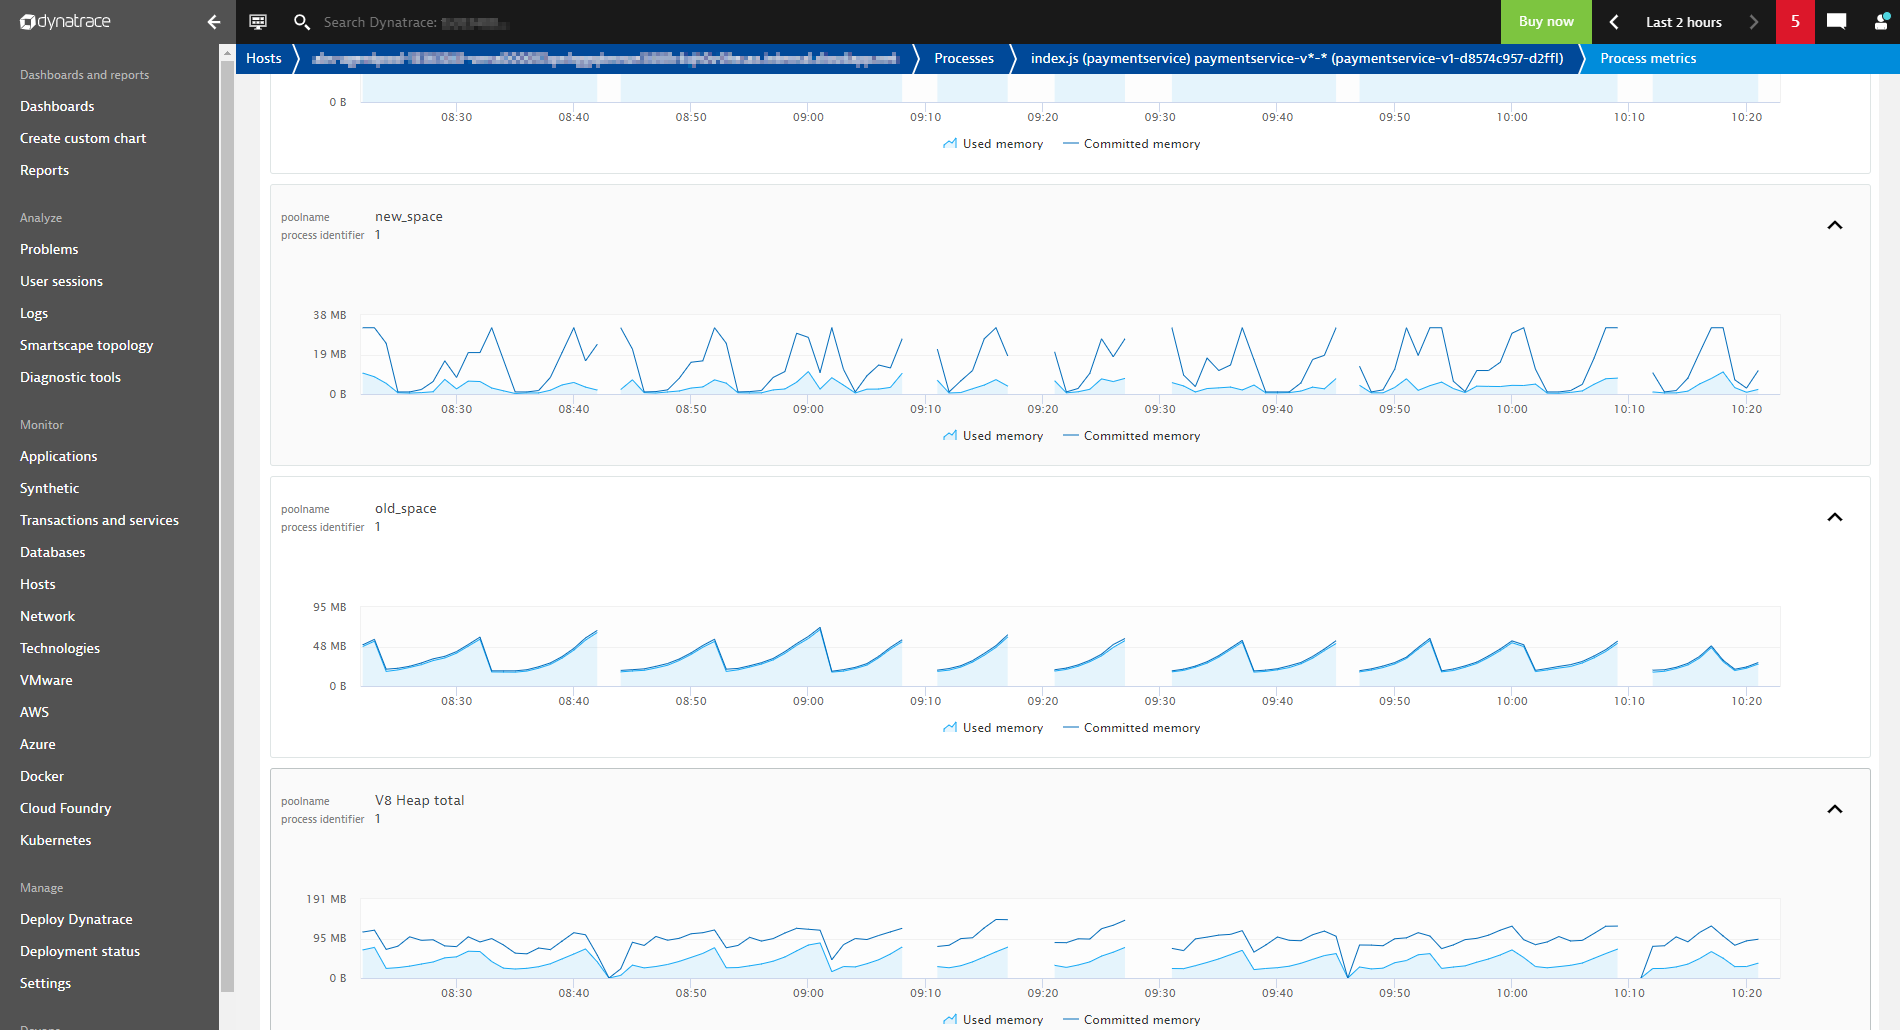
The screenshot above shows a scenario in which the paymentservice-v1-d8574c957-vgwkh pod has a crashing container. The Node.js application seems to have a memory leak. Fortunately, the paymentservice-v1 deployment runs multiple replicas, so the end users of this service aren’t impacted. With the addition of events, we have deeper insights into this problem, which might have gone unnoticed otherwise. To increase the stability of the cluster, protect its resources, and give developers cues as to how to address problems in their code, the root cause should be addressed.
How to get started?
You can enable event integration on the Kubernetes settings page where you set up Kubernetes API monitoring for your clusters.
Event ingestion follows the Kubernetes established format of field selectors. With this approach, we achieve our goal of flexibility by choosing events based on event resource fields such as source.component, type, or involvedObject.
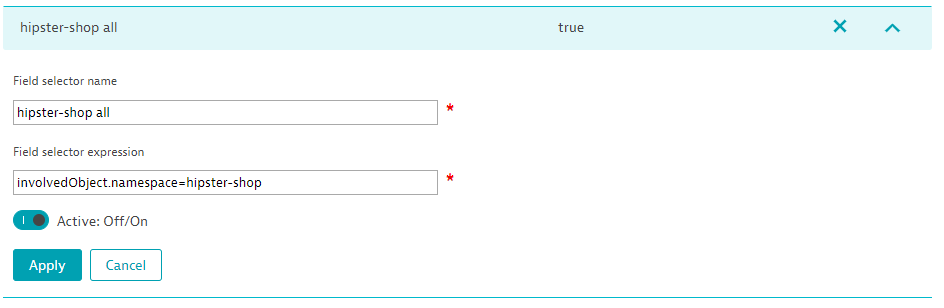
To get maximum flexibility and fine-grain control over the events you want Dynatrace to ingest from Kubernetes, set up multiple field selectors and build compound expressions for each Kubernetes environment. For details, see Monitor your Kubernetes clusters with Dynatrace.
The event field selectors can also be defined via Dynatrace API.
Note: Kubernetes event integration is available within an Early Adopter release. Kubernetes events ingested into Dynatrace are subject to custom metric licensing and are free of charge during the Early Adopter release phase.
What’s next
There are a number of exciting enhancements planned on our Kubernetes roadmap, with announcements planned throughout the year. In the near term, we’ll wrap up development of these features:
- Cloud application and workload analysis
- Universal container-level metrics (Linux) for resource contention analytics and custom charting
We encourage you to check out the planned enhancements for monitoring Kubernetes and to share your feedback at Dynatrace answers.


Looking for answers?
Start a new discussion or ask for help in our Q&A forum.
Go to forum