
We’re proud to introduce a significant improvement to Dynatrace Log Monitoring that will empower all your teams. In our investigations of how various teams work with logs as a data source within Dynatrace, two significant use cases have emerged:
Use case #1: Troubleshooting
Imagine that a bug has made its way into production. An object churn causes high memory usage. This leads to garbage collectors kicking in, causing process restarts. Davis®, the Dynatrace AI-driven causation engine, detects those process restarts and shows you exactly which processes and services are affected. With Dynatrace Log monitoring, you’re only one click away from investigating the log events that were captured during the problem time frame and beginning any required remediation efforts.
For extended troubleshooting, you need to analyze specific logs in an ad-hoc fashion within a relatively short problem time frame in the context of a specific process, or host.
Use case #2: Monitoring
This would be valuable if, for example, a security problem is discovered in production. Let’s assume confidential data was logged due to a bug. The security team has to find out when, and in which application versions, this bug occurs. This can be quite a challenge in today’s microservices architectures where containers are ephemeral.
To enhance your monitoring toolset, significant log events must be analyzed across multiple logs within a dynamic environment, and potentially a longer time frame. Alerting is also key.
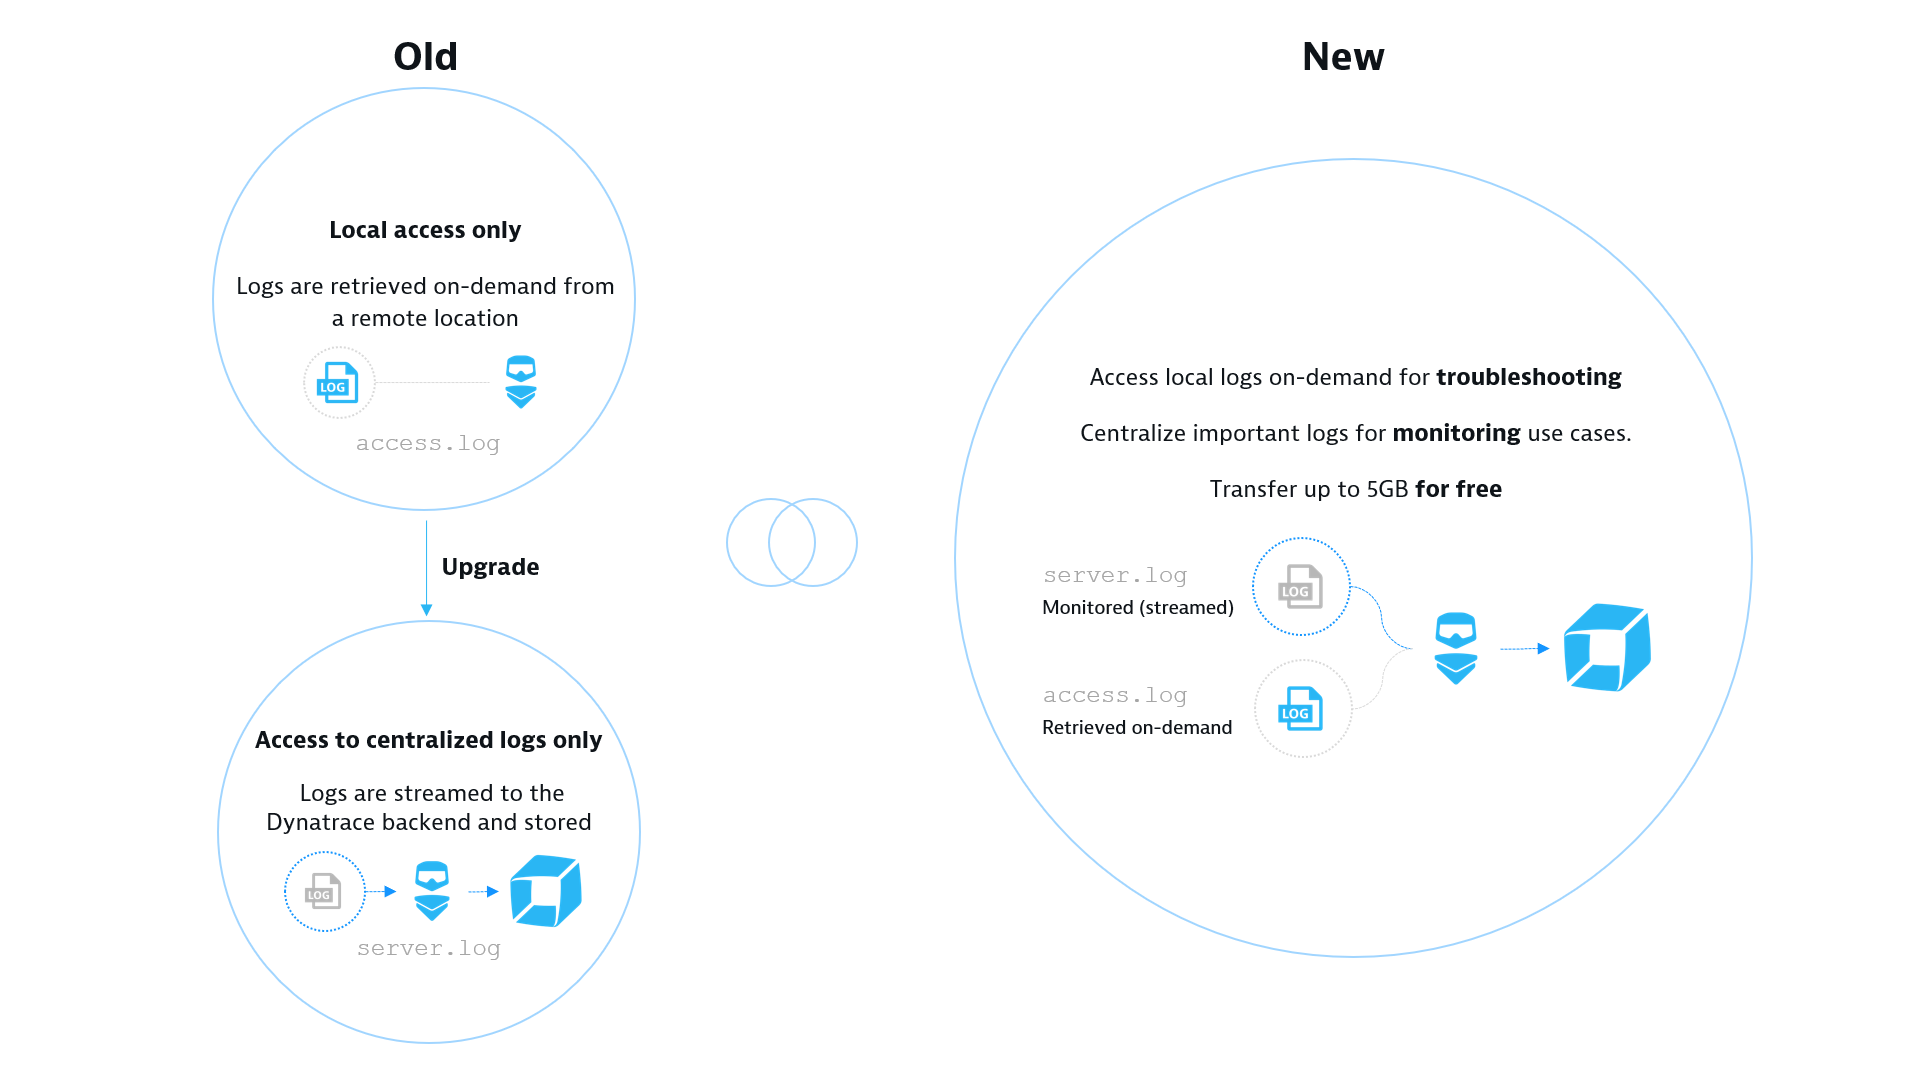
Provide centralized log monitoring and local access on demand
Effective with Dynatrace version 1.174, Log Monitoring provides you with the flexibility to selectively centralize important logs for monitoring purposes while retaining access to logs from OneAgents that are installed on remote hosts, which are helpful for troubleshooting purposes.
What you get
Log discovery and troubleshooting out of the box with Dynatrace OneAgent
Dynatrace does all the heavy lifting for you. Dynatrace detects and automatically puts log files in the context of the corresponding host or process with no need for manual configuration. For details, see How to enable Log Monitoring.
- Auto-discovery of process and operating system logs.
- Analyze one log file at a time in the context of hosts and processes.
- A maximum of 500 MB and 7 days of log data can be viewed.
- Search for text patterns within one specific log file.
Flexible log monitoring—extended value with centralized monitoring
Dynatrace is flexible. We adjust to your team’s requirements related to which log files should be centralized within Dynatrace. You can start with a small footprint of centralized (monitored) files and support more teams over time.
- Transfer up to 5 GB of log data in total per year for freeFor Dynatrace Managed, the initial quota is a total of 5 GB per year of log data transfer.
For Dynatrace SaaS, the initial quota is 500MB (0.5GB) of yearly storage. - Search for text patterns across multiple monitored logs
- Alerts based on text pattern occurrences across monitored logs
- Retain data from 5 to 90 days
- Retrieve stored log data via API
- Stay up to date with upcoming features
How to get it
There’s nothing you need to do to get this Log Monitoring upgrade. You’ll automatically get the new Dynatrace Log Monitoring capabilities once you upgrade to Dynatrace version 1.174.
How it works
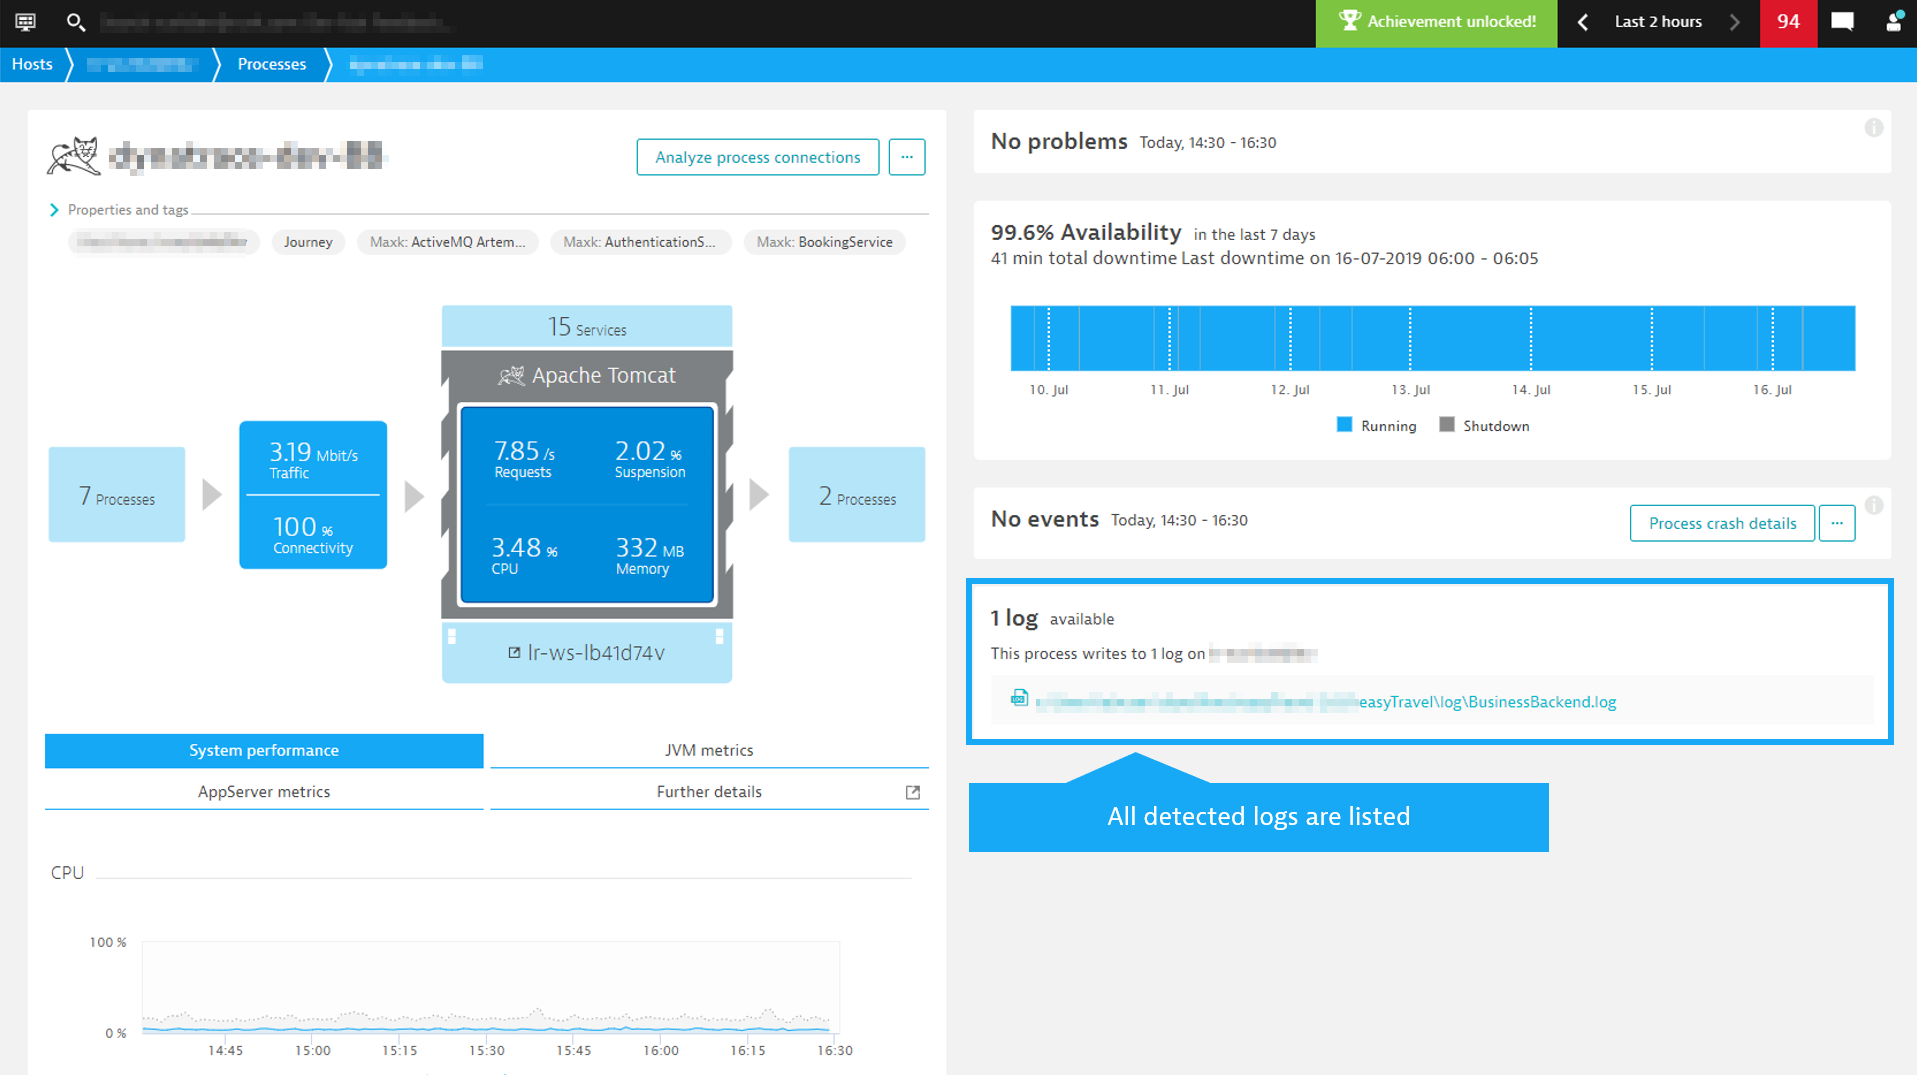
All detected log files are listed on the corresponding process group/process or host overview pages. For details, see log detection and supported log format.
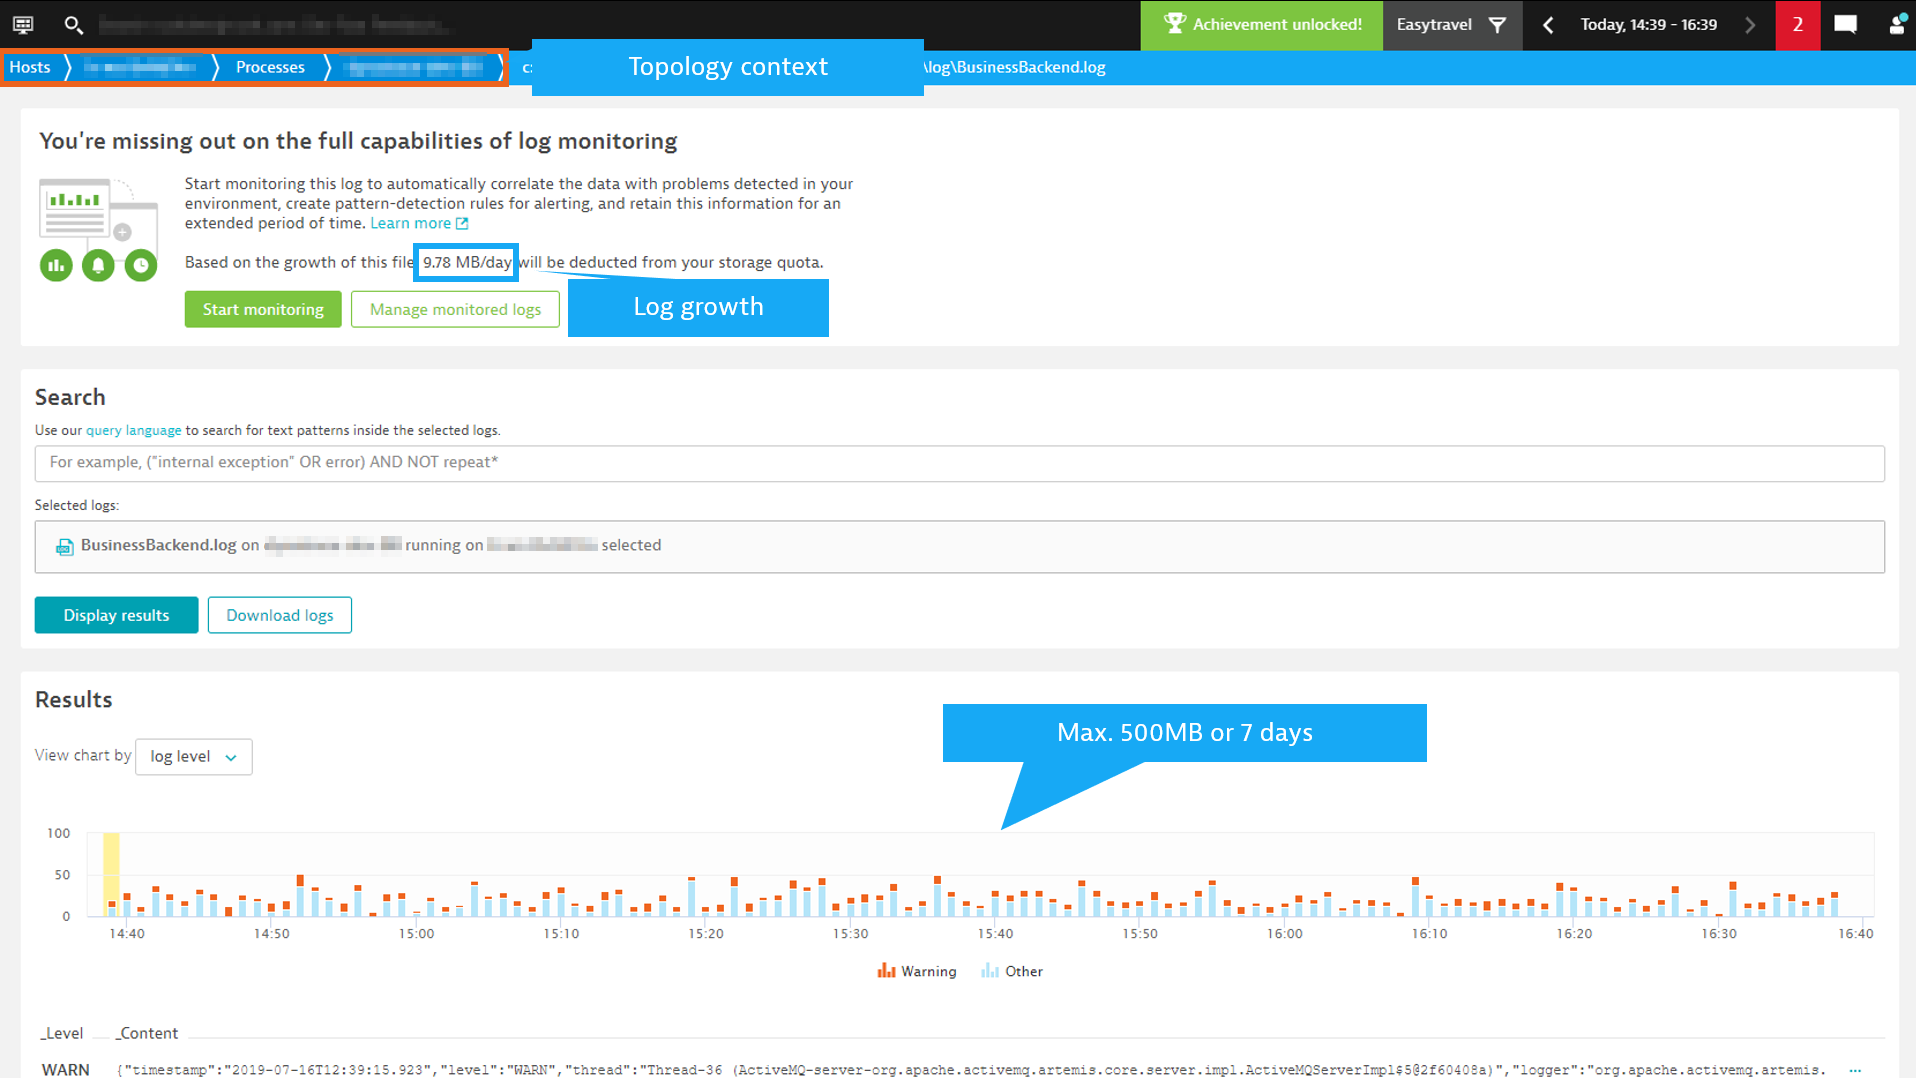
Local log files
When viewing a local log file, you’ll see a note at the top of the page that provides the option to start monitoring the file and to globally manage all monitored files. Initially, unless you’re already using our premium offering, no log files are centralized. The Dynatrace web UI refers to centralized files as “monitored” log files. Dynatrace performs additional post-processing and analysis on these monitored files.
Centralize log files
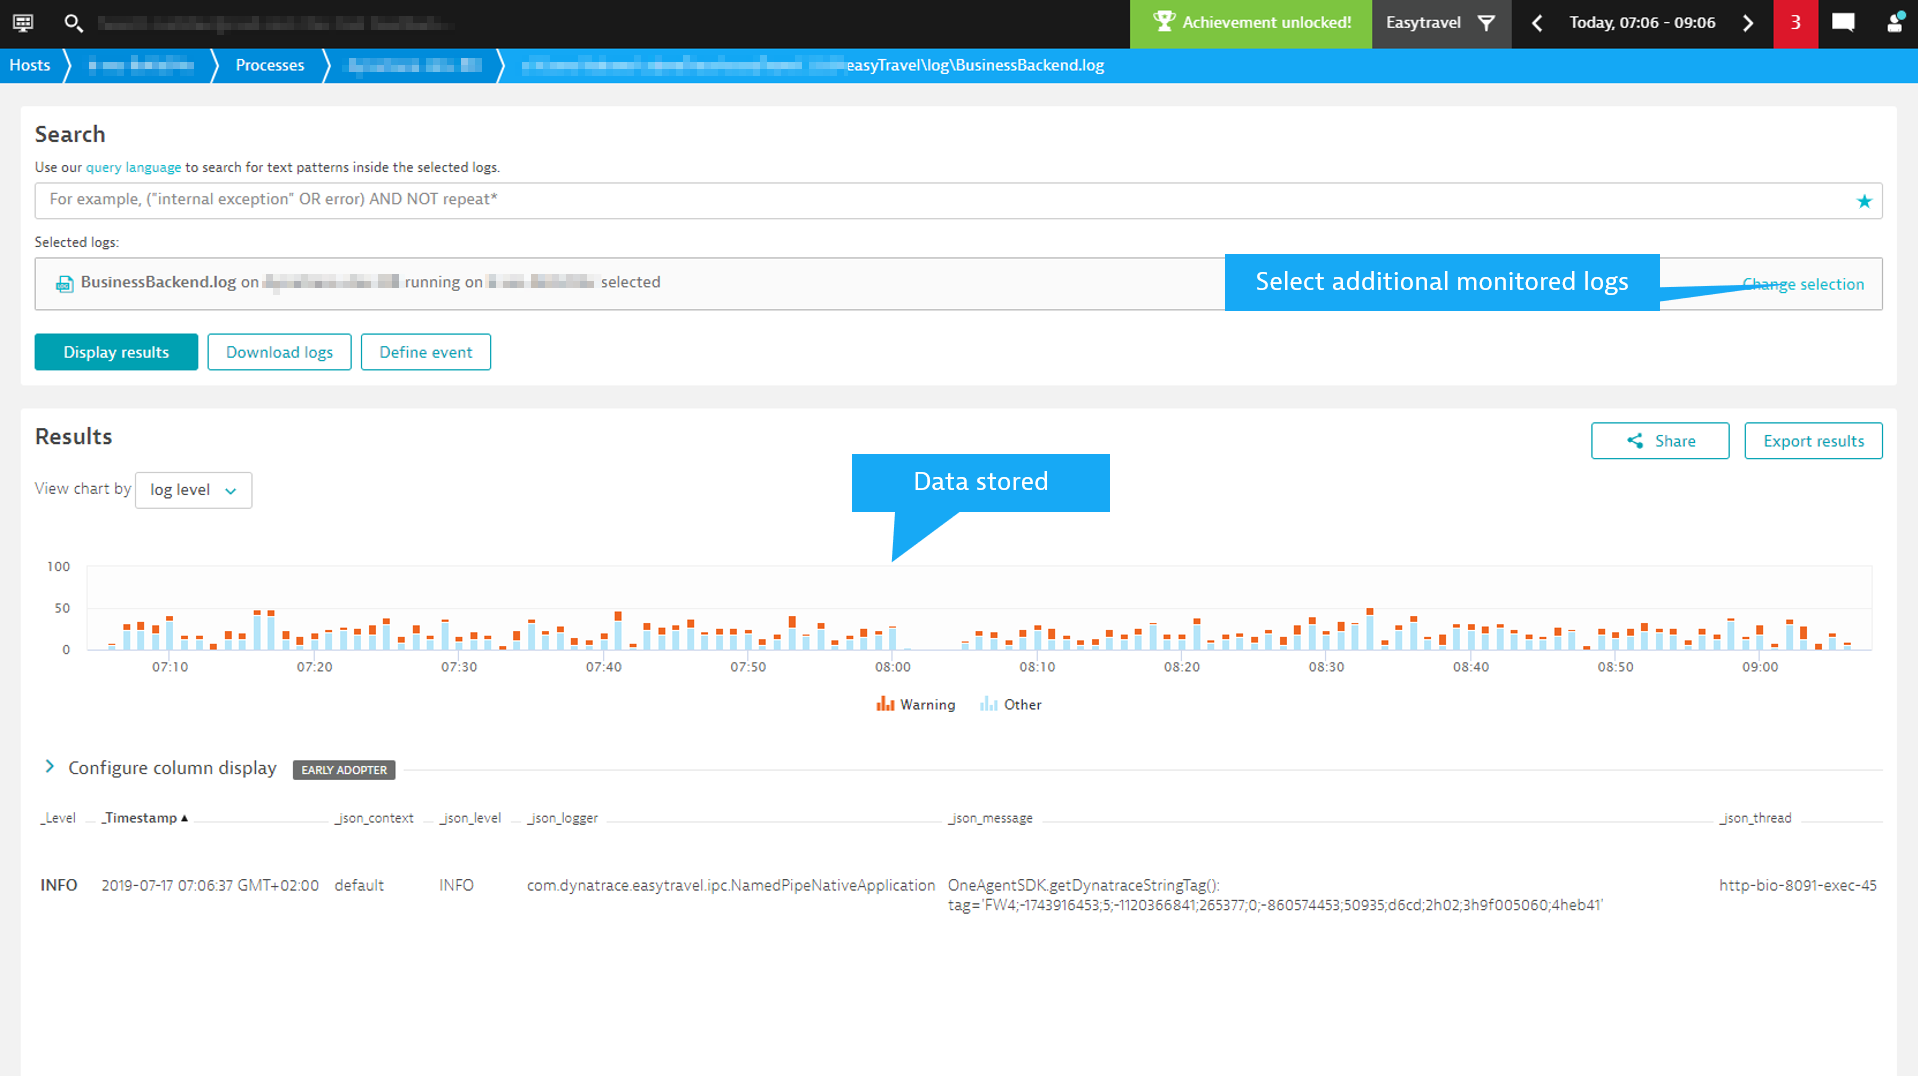
When you select Start monitoring, the currently visible data is stored (up to 500 MB or a maximum timeframe of 7 days).
To store log files centrally for use with Dynatrace Managed, a common Network File System (NFS) mount point (path) must be provided. Note that this is a configuration change, so only users with the Change monitoring settings permission can perform this action.
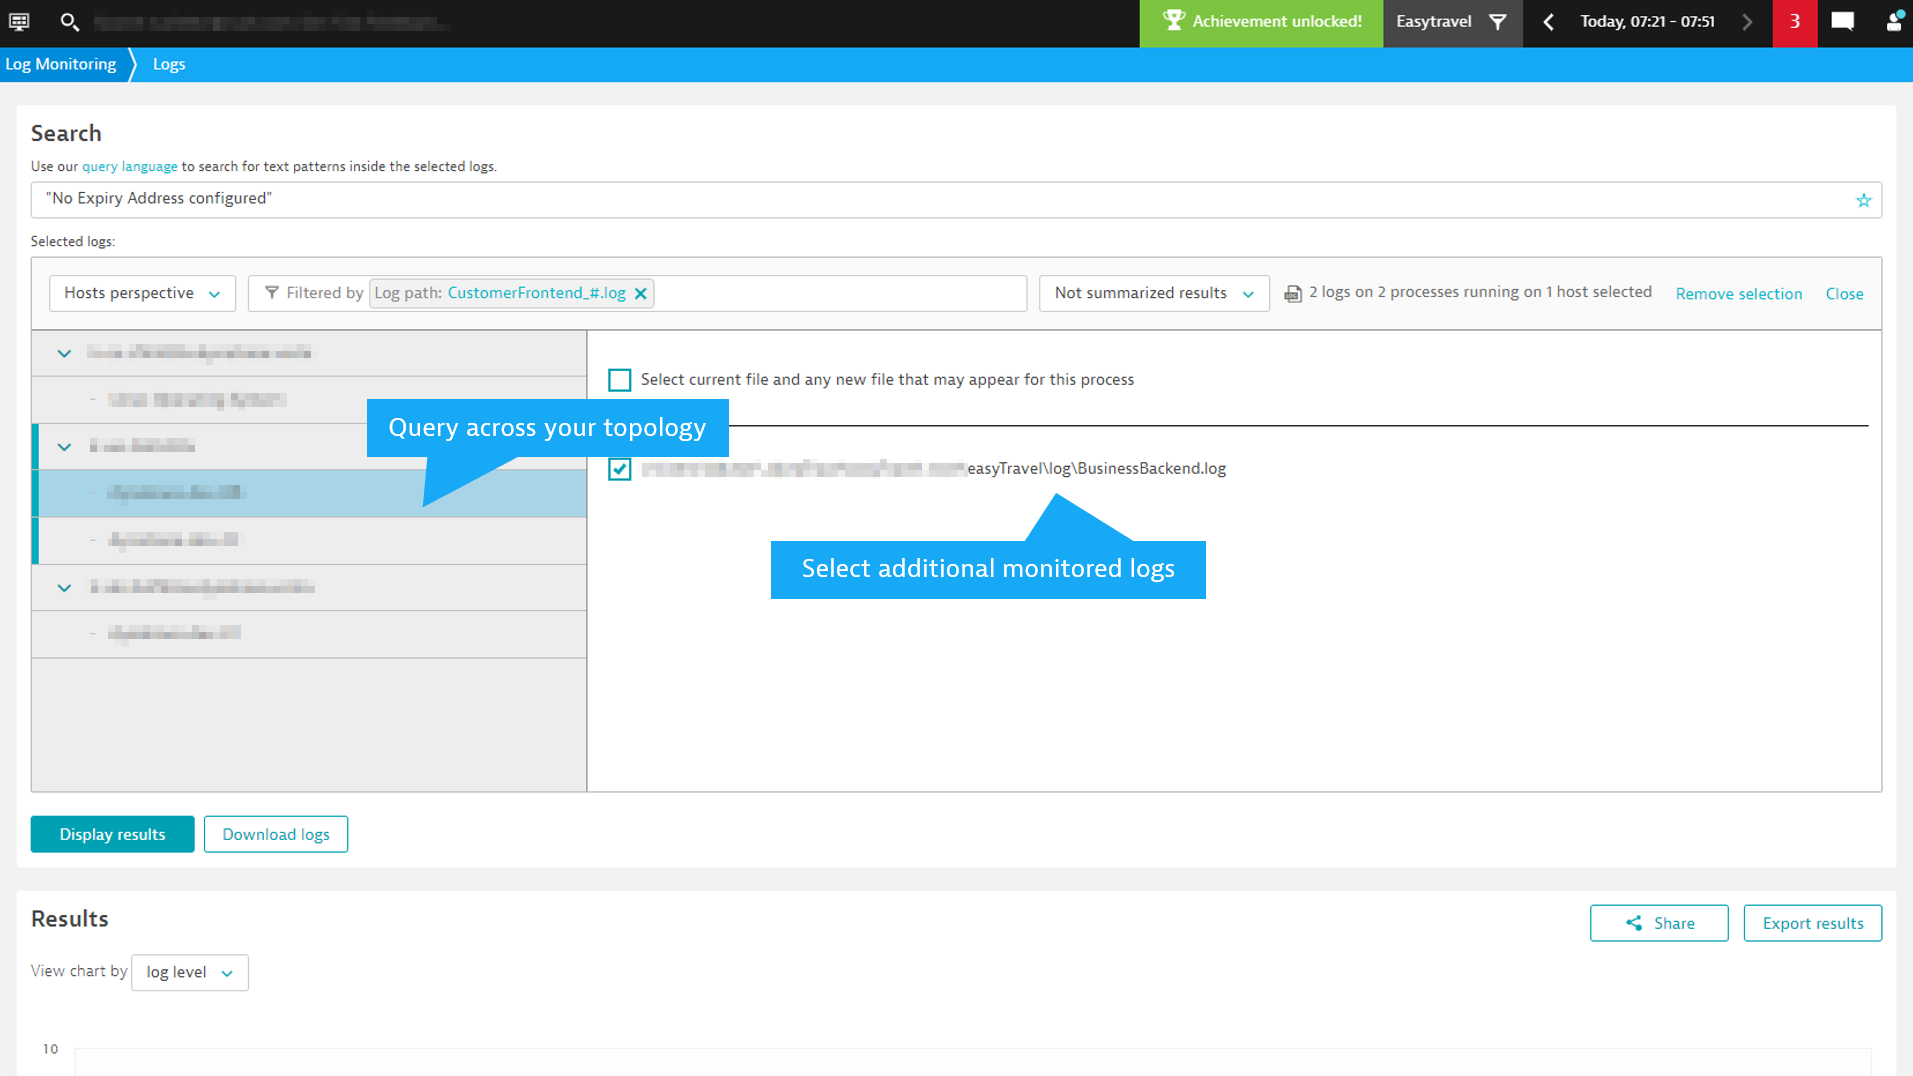
The full set of capabilities is then available for monitored log files, including the ability to analyze and search across multiple log files.
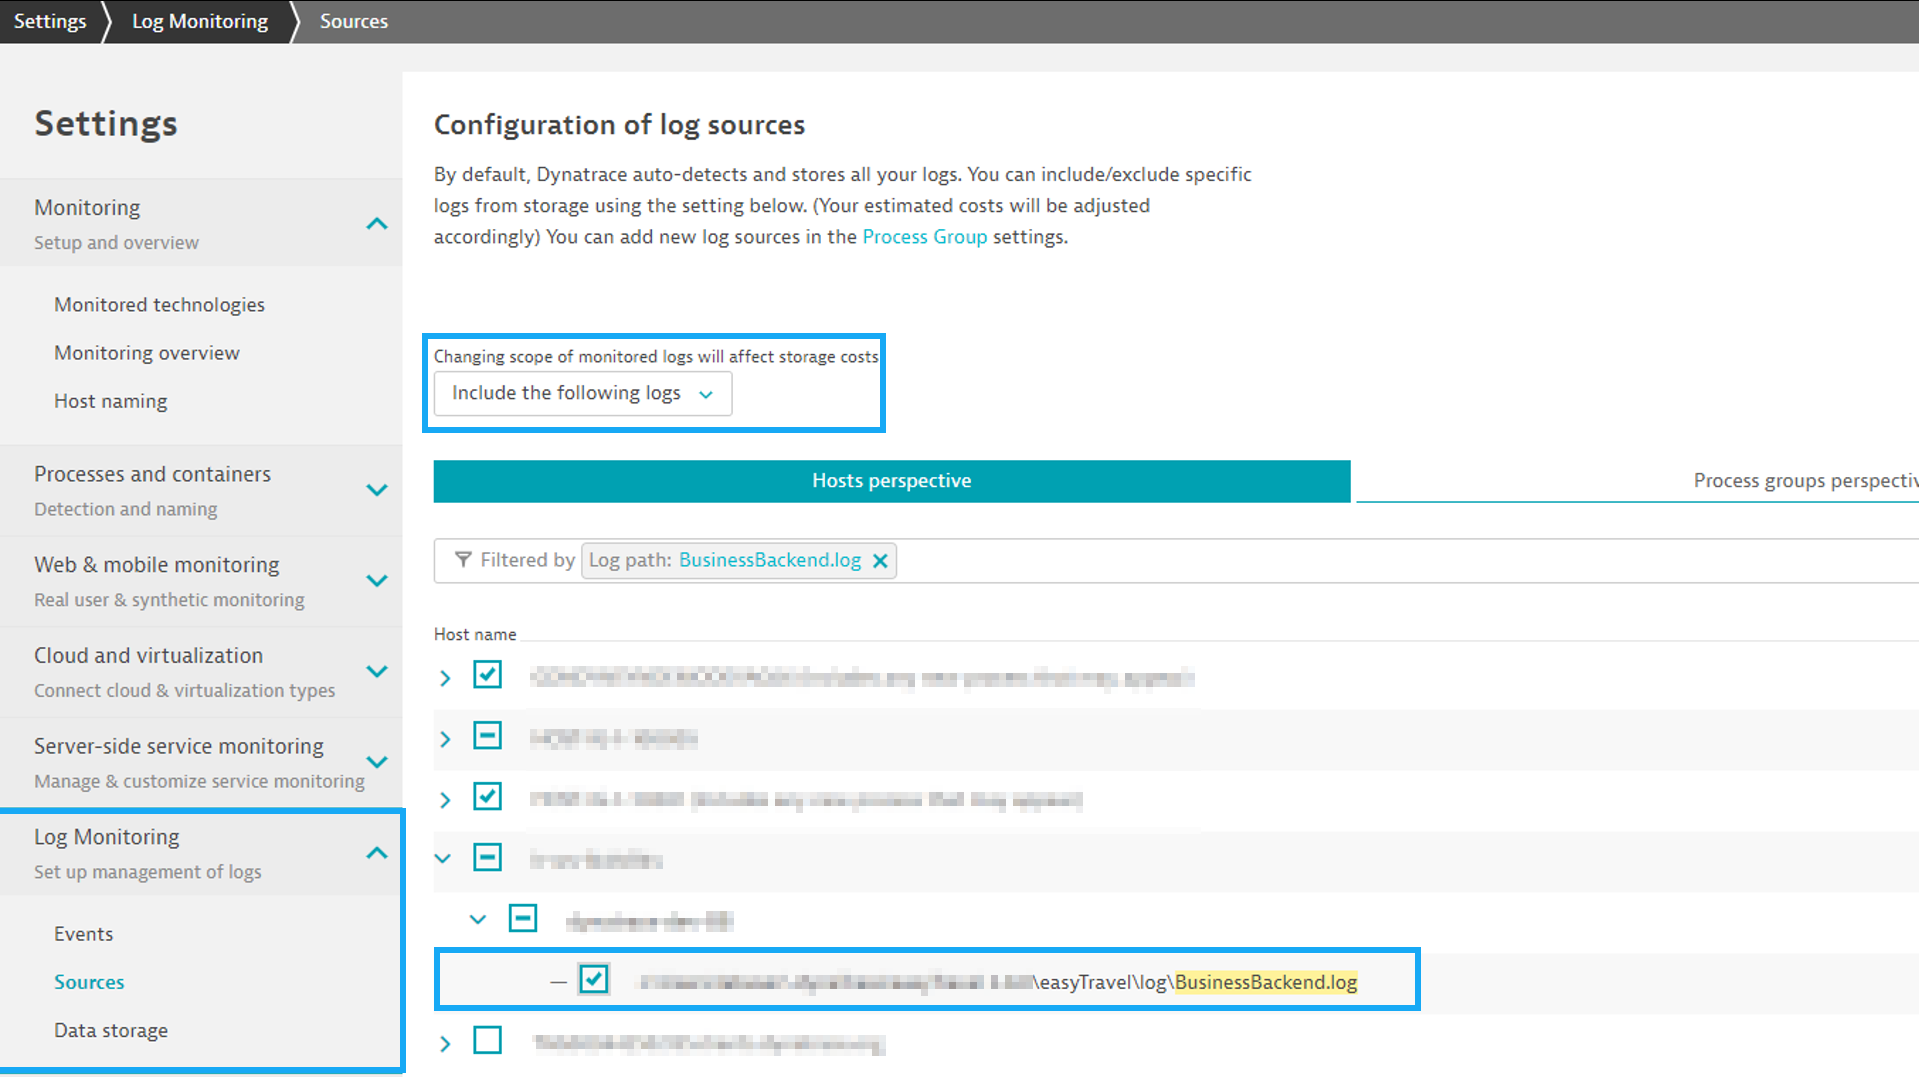
Manage monitored logs
All detected log files are visible at Settings > Log Monitoring > Sources. Those logs that are already monitored have checkmarks displayed next to them. Add and remove log files based on your requirements.
Important summary for existing customers
If you use our premium offering
- You will gain local access to log files for troubleshooting purposes. This reduces the need to centralize all log files and introduces increased flexibility.
- There are no changes to your current configuration of monitored log files.
- There are no changes to your currently used log events.
- There are no changes to your license.
If you use the free tier of Dynatrace Log Monitoring
Here’s what remains the same:
- You can still access any discovered log file for troubleshooting purposes.
- Your currently used log events will continue to be operational.
- The limits for analysis timeframes (7 days) and analyzed data (500 MB) still apply.
Here’s what’s changing:
In order to give you the ability to evaluate our current capabilities and stay up to date with the latest enhancements, you now have the ability to transfer 5 GB of log data per year, free of charge.
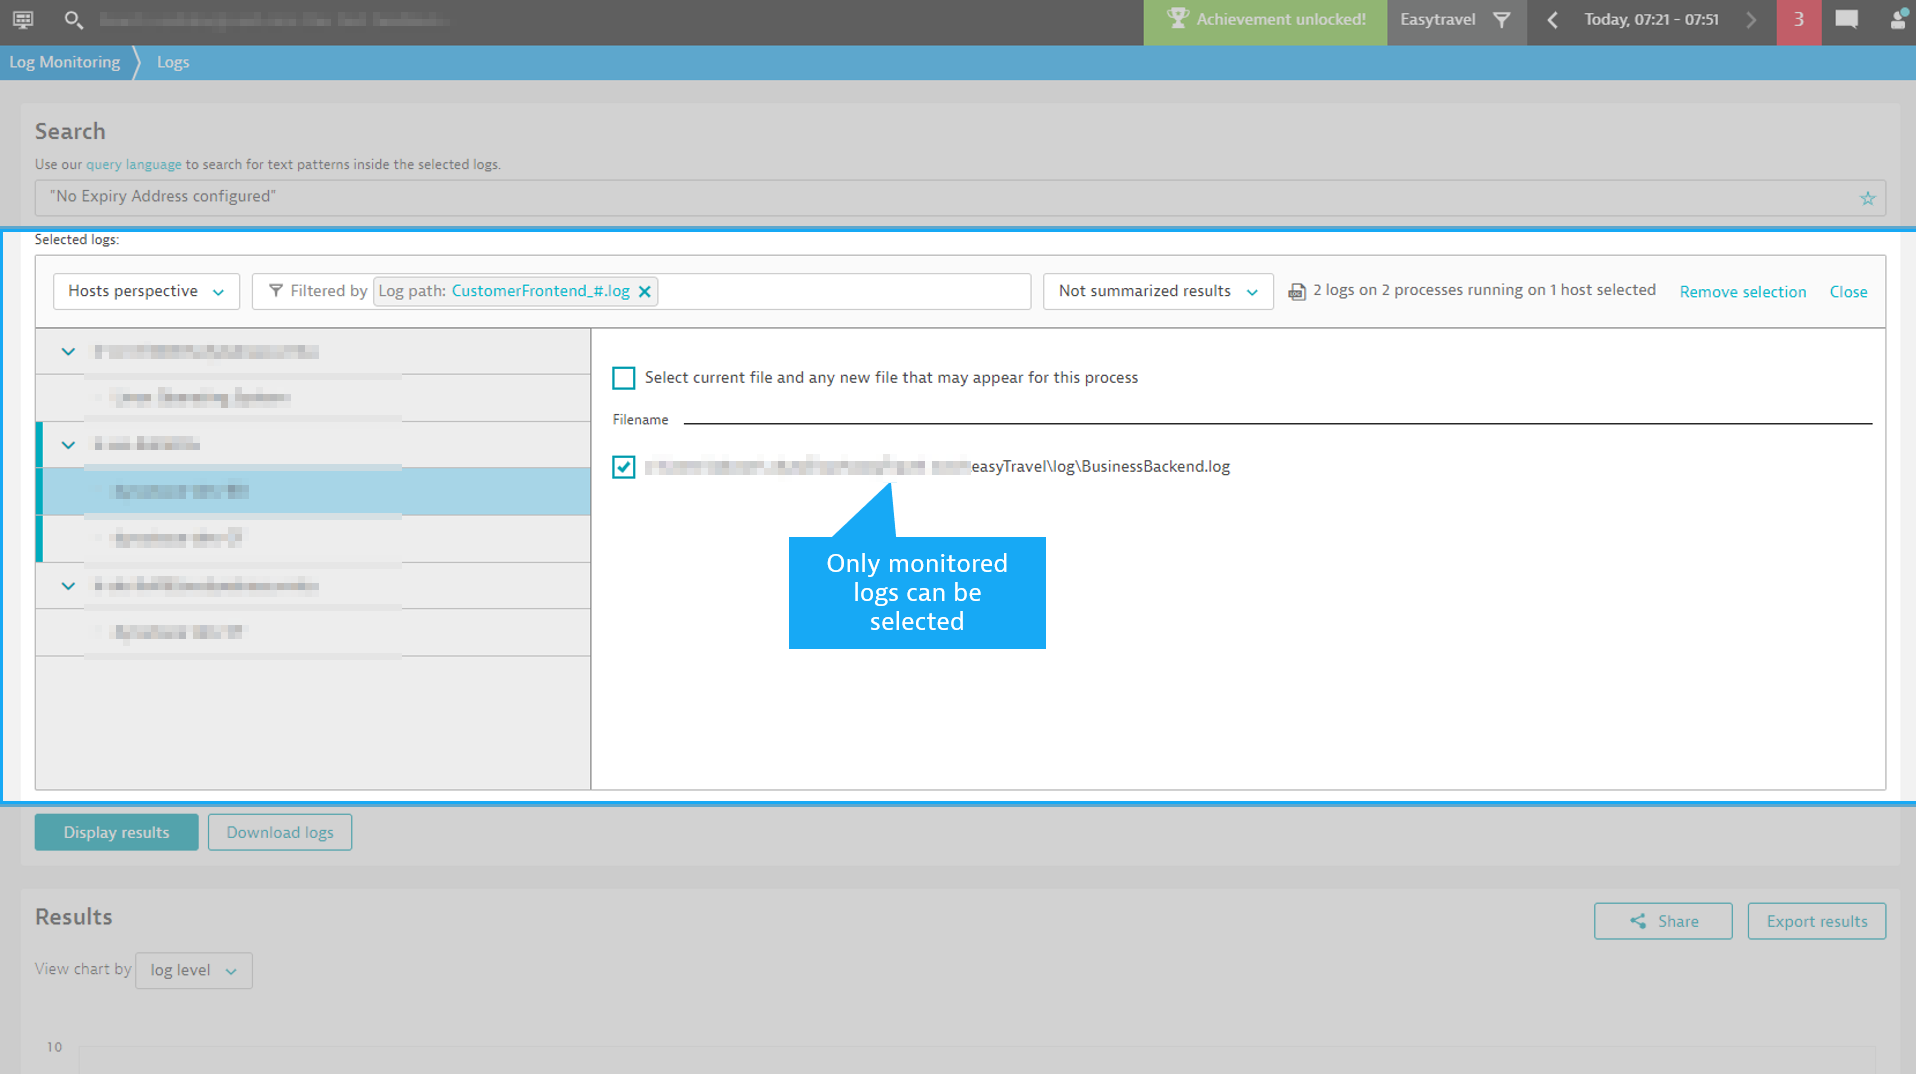
Previously, you had the ability to search for text patterns across a maximum of 20 log files and 500 MB of data in total. Going forward, the ability to query across multiple log files will be limited to centralized (monitored) logs. This gives us greater flexibility to improve performance and usability going forward.
What’s next
Custom metrics based on log pattern occurrences
In upcoming releases, we’ll provide the ability to subscribe to custom metrics based on monitored log files. This will provide:
- The ability to turn query results for text pattern occurrences into timeseries metrics.
- Automatic correlation of log custom metrics by Davis in the context of problems.
- The creation of custom alerts based on custom metrics.
- The ability to use log custom metrics in charts and dashboards.
Log events will be deprecated
With the introduction of custom metrics, log events will be deprecated. Existing log events will remain unchanged and continue to work. Details will be provided soon. As custom metrics will automatically be correlated by Davis, the need for alerting rules will be reduced. For alerting on custom thresholds, custom metrics will be available for custom alerts.
Continuously improved usability
We’re working on improving the UI and navigation for Dynatrace Log Monitoring. Stay tuned for details.
Your feedback matters
We’re ramping up, and as always, we’re listening closely to your feedback. Please share your feedback and use cases with us in our product ideas forum.


Looking for answers?
Start a new discussion or ask for help in our Q&A forum.
Go to forum