NEW: RUM Live and Page Views dashboards

Shortly before the end of the year, we snuck in a couple of last-minute gifts for 2021. It was a great year for SpeedCurve with a lot of renewed focus on RUM. We couldn't think of a better way to finish out the year than to launch the new Live and Page Views dashboards. Let's take a look!
RUM Live
How are users experiencing my site right now? The Live dashboard gives you a near real-time view of how users are interacting with your website. This is a great way to spot current issues or just answer the question 'Are my users happy?'
There are several components on this dashboard, which all automatically refresh to give you the most current look at user performance.
Summary
Here you'll find a high-level overview for your site over the most recent time period, so you can see basic usage metrics at a glance. The default time period is 30 minutes, but you can select anything from 15 minutes to 12 hours.

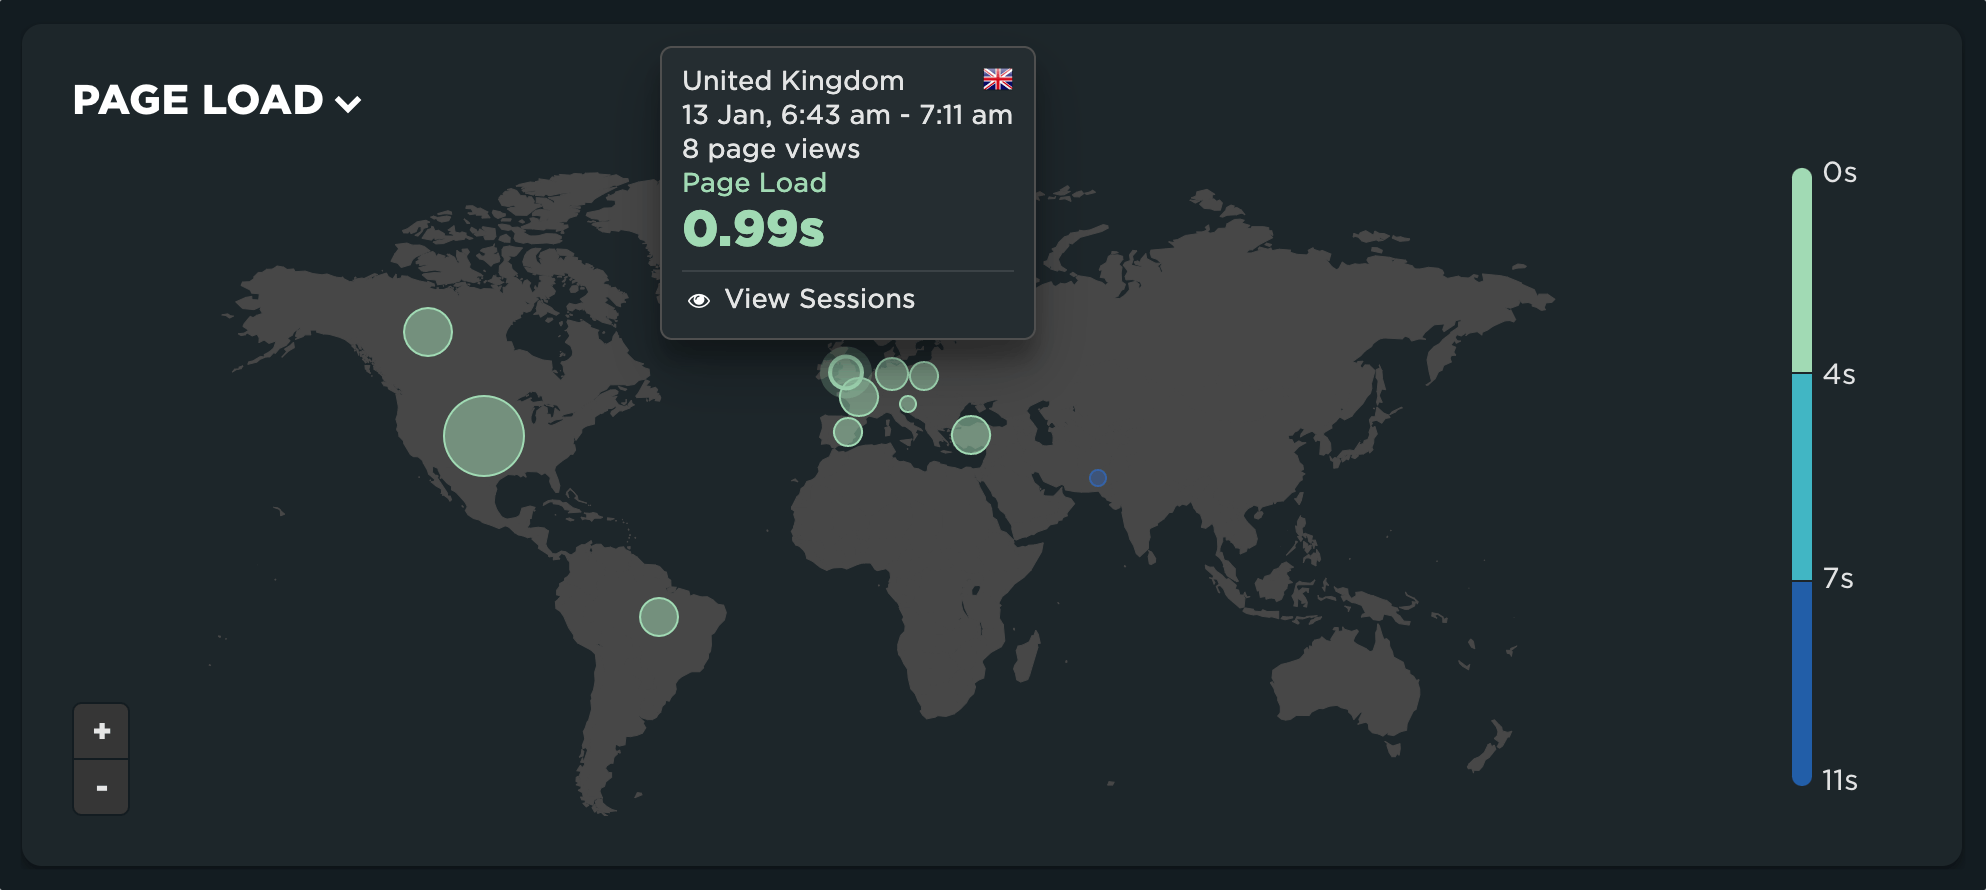
Geographic performance
Understanding performance across different markets is critical for site owners. Are investments you've made into your CDN paying off? Did you realize you were getting traffic from Turkey? Now you can quickly see performance by country for any of your favorite metrics. The gradient scale will help you to understand varying levels of performance, while the size of the bubble indicates the volume of users in that region.
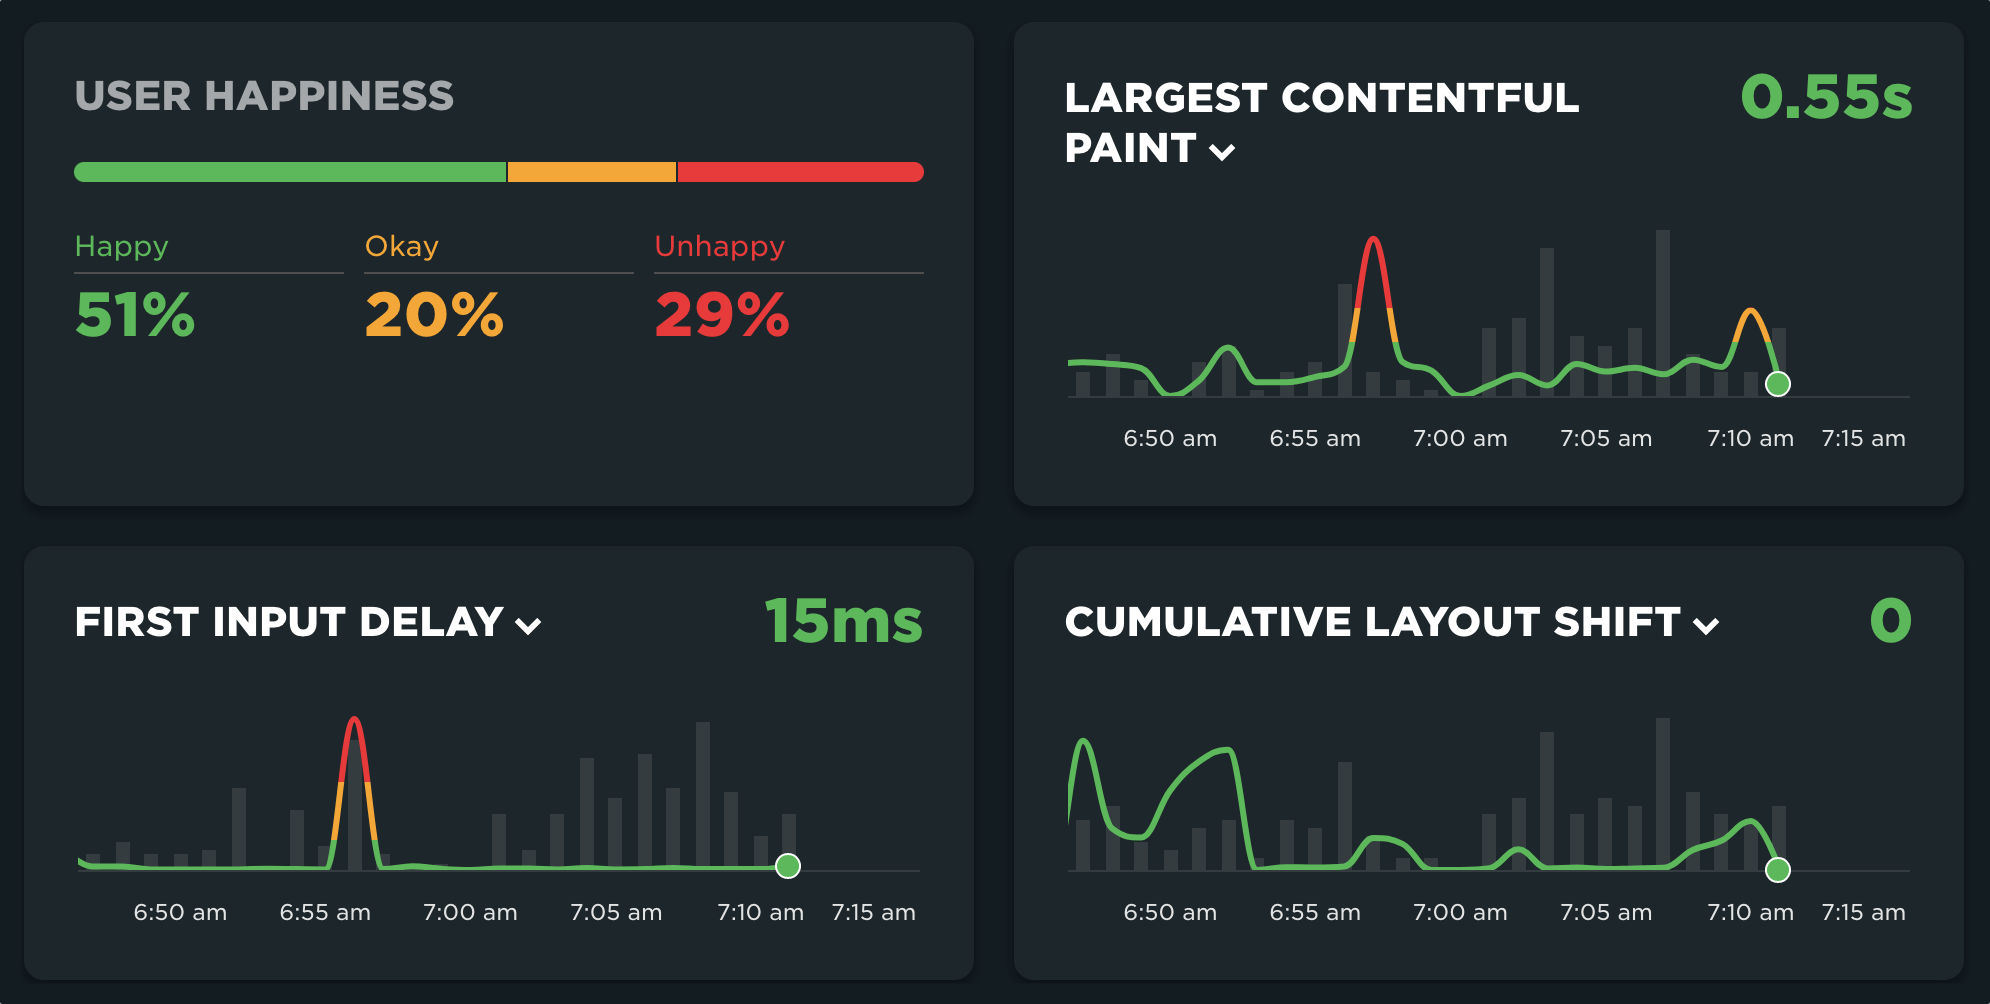
User Happiness and Core Web Vitals
Our user happiness scoring quickly identifies the impact performance has on the user experience of your site. We've also included a new performance time-series view with page view columns to indicate the performance of key metrics compared with the size of the sample over the period. Core Web Vitals are presented by default, but you can select any of the metrics you care about for these charts.
Sessions
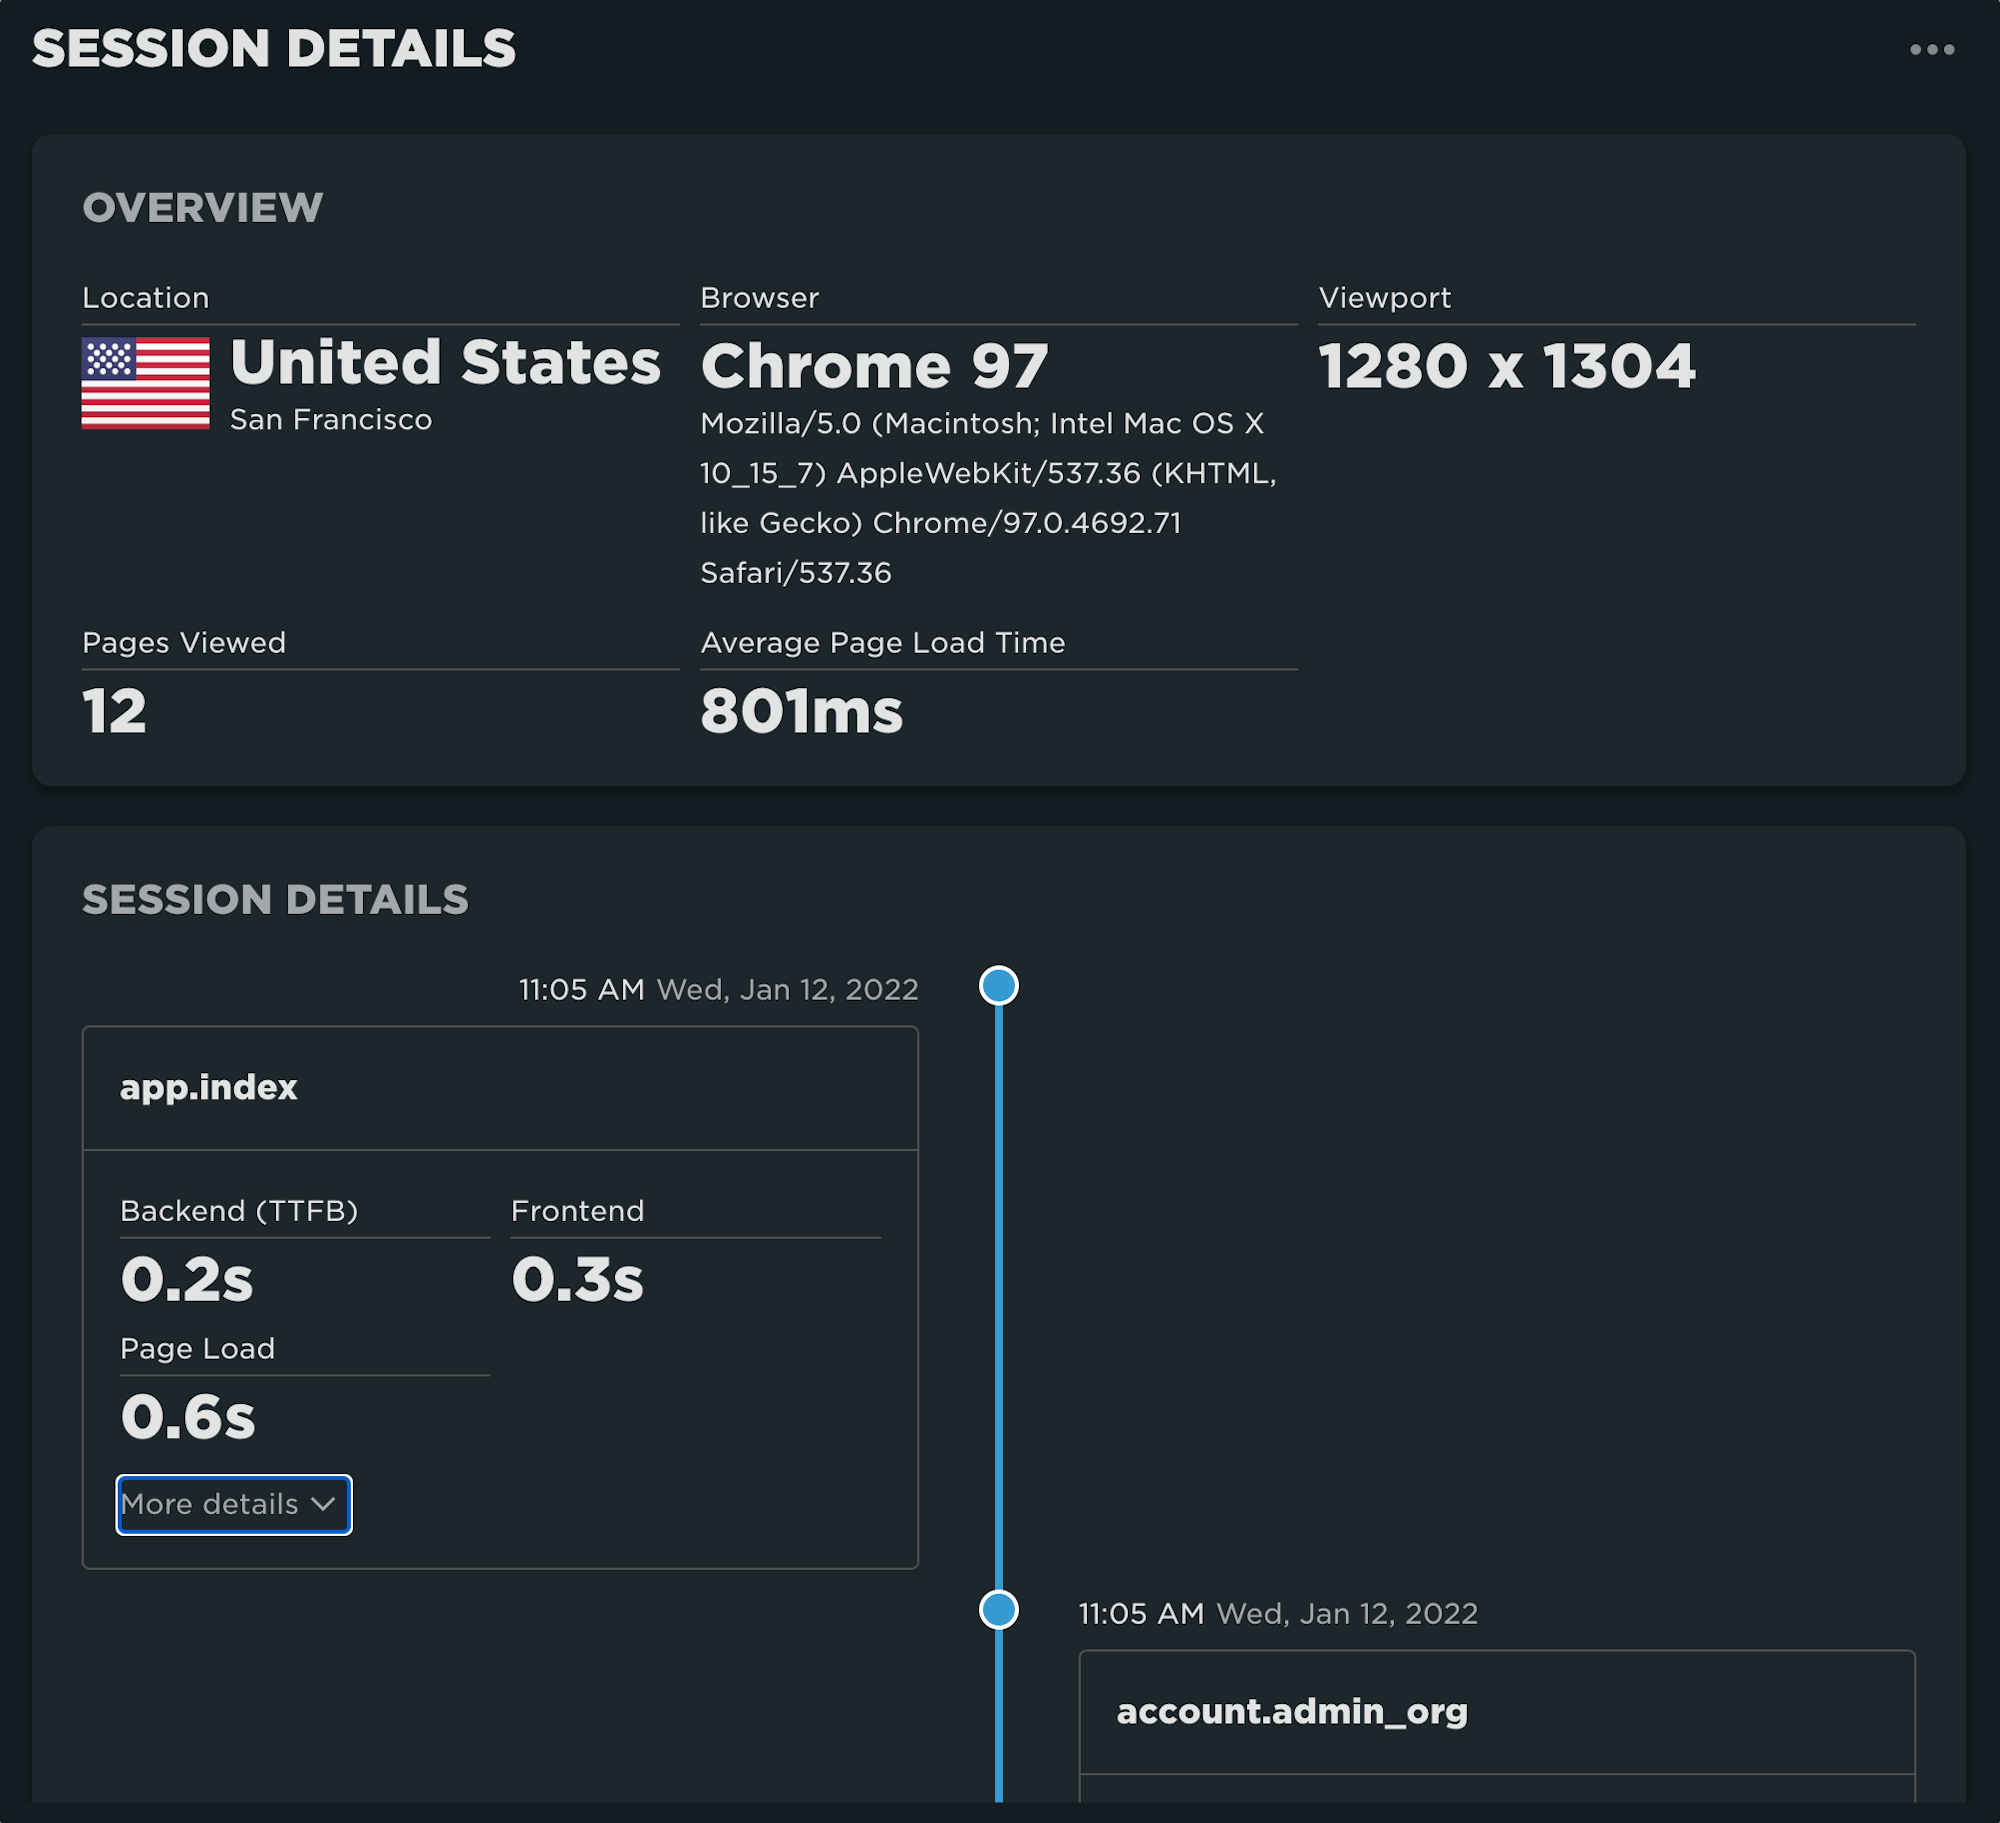
Finally, the last component on this dashboard is the 'Latest Sessions' table. This is a list of the most current user sessions on your site.
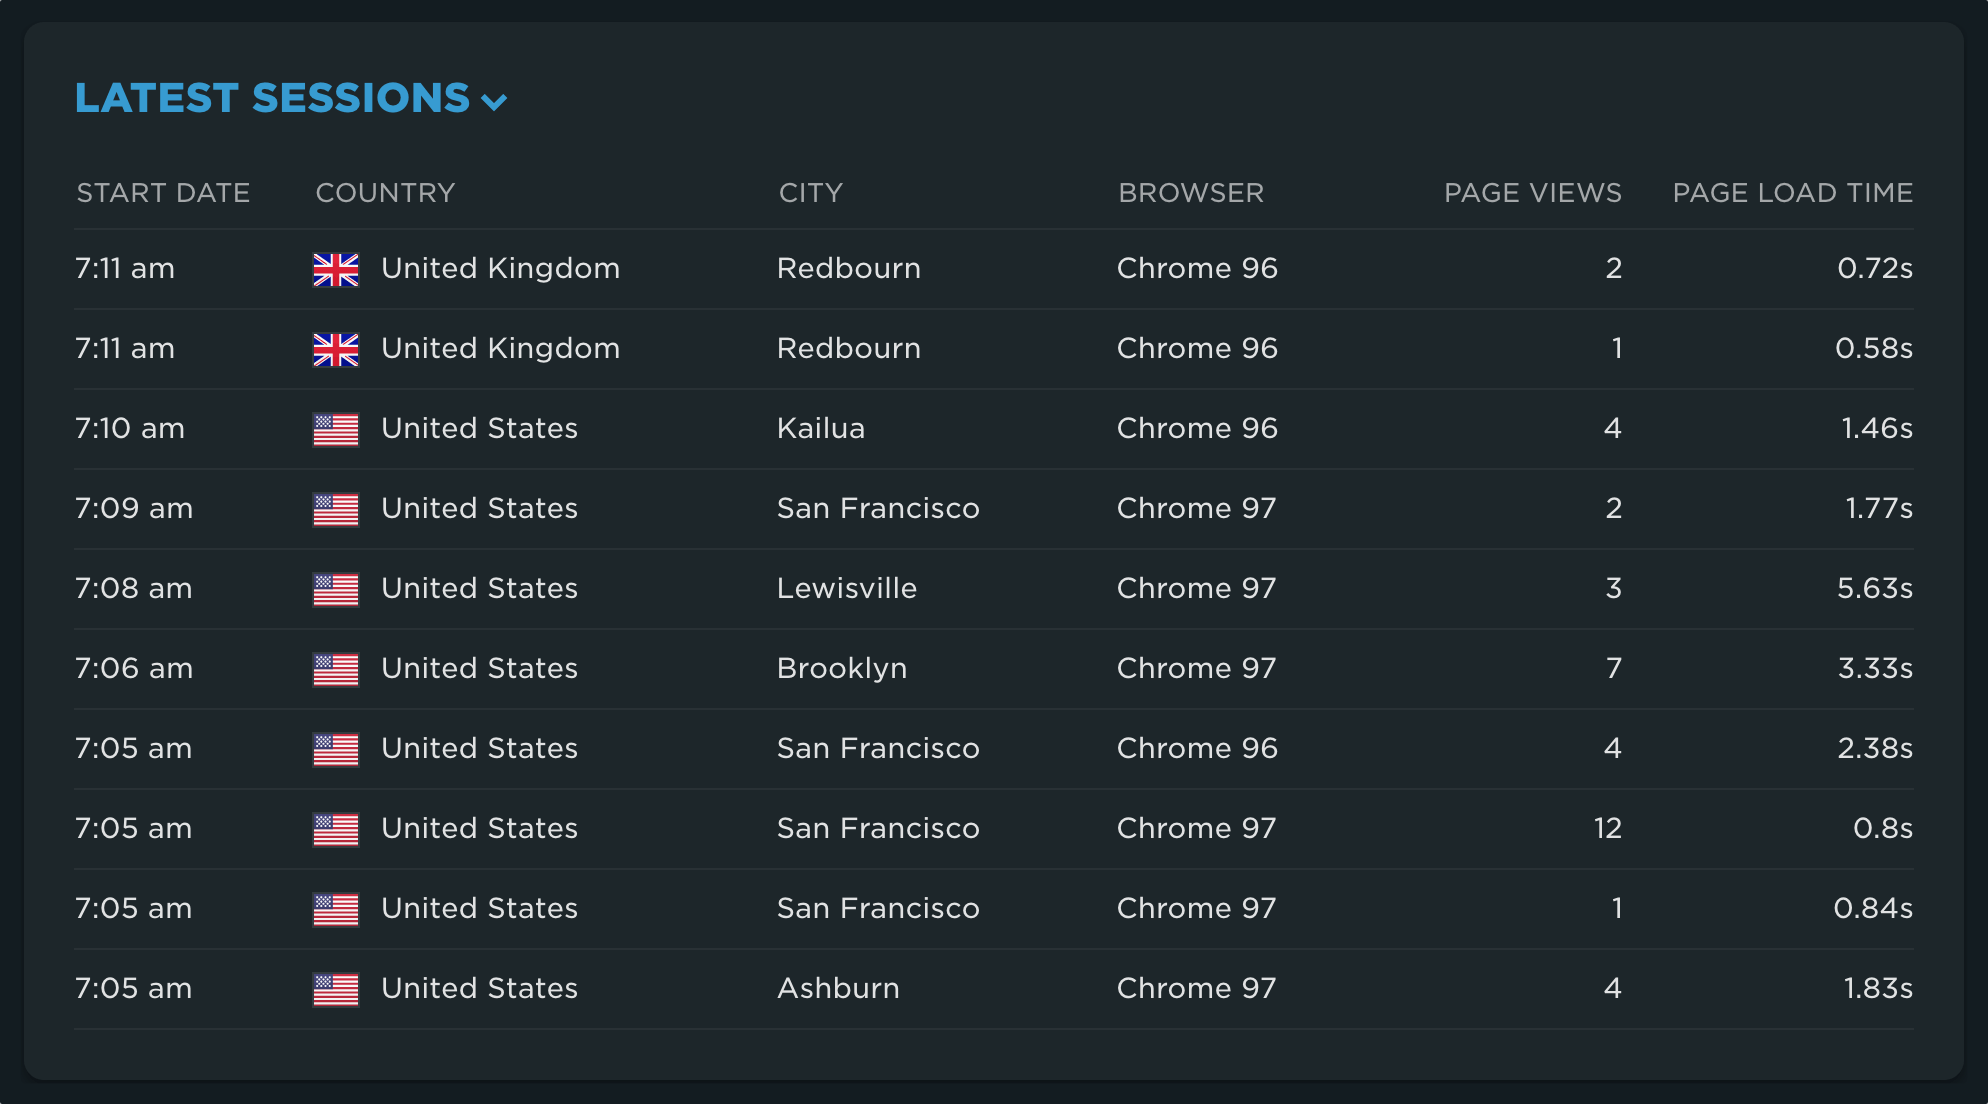
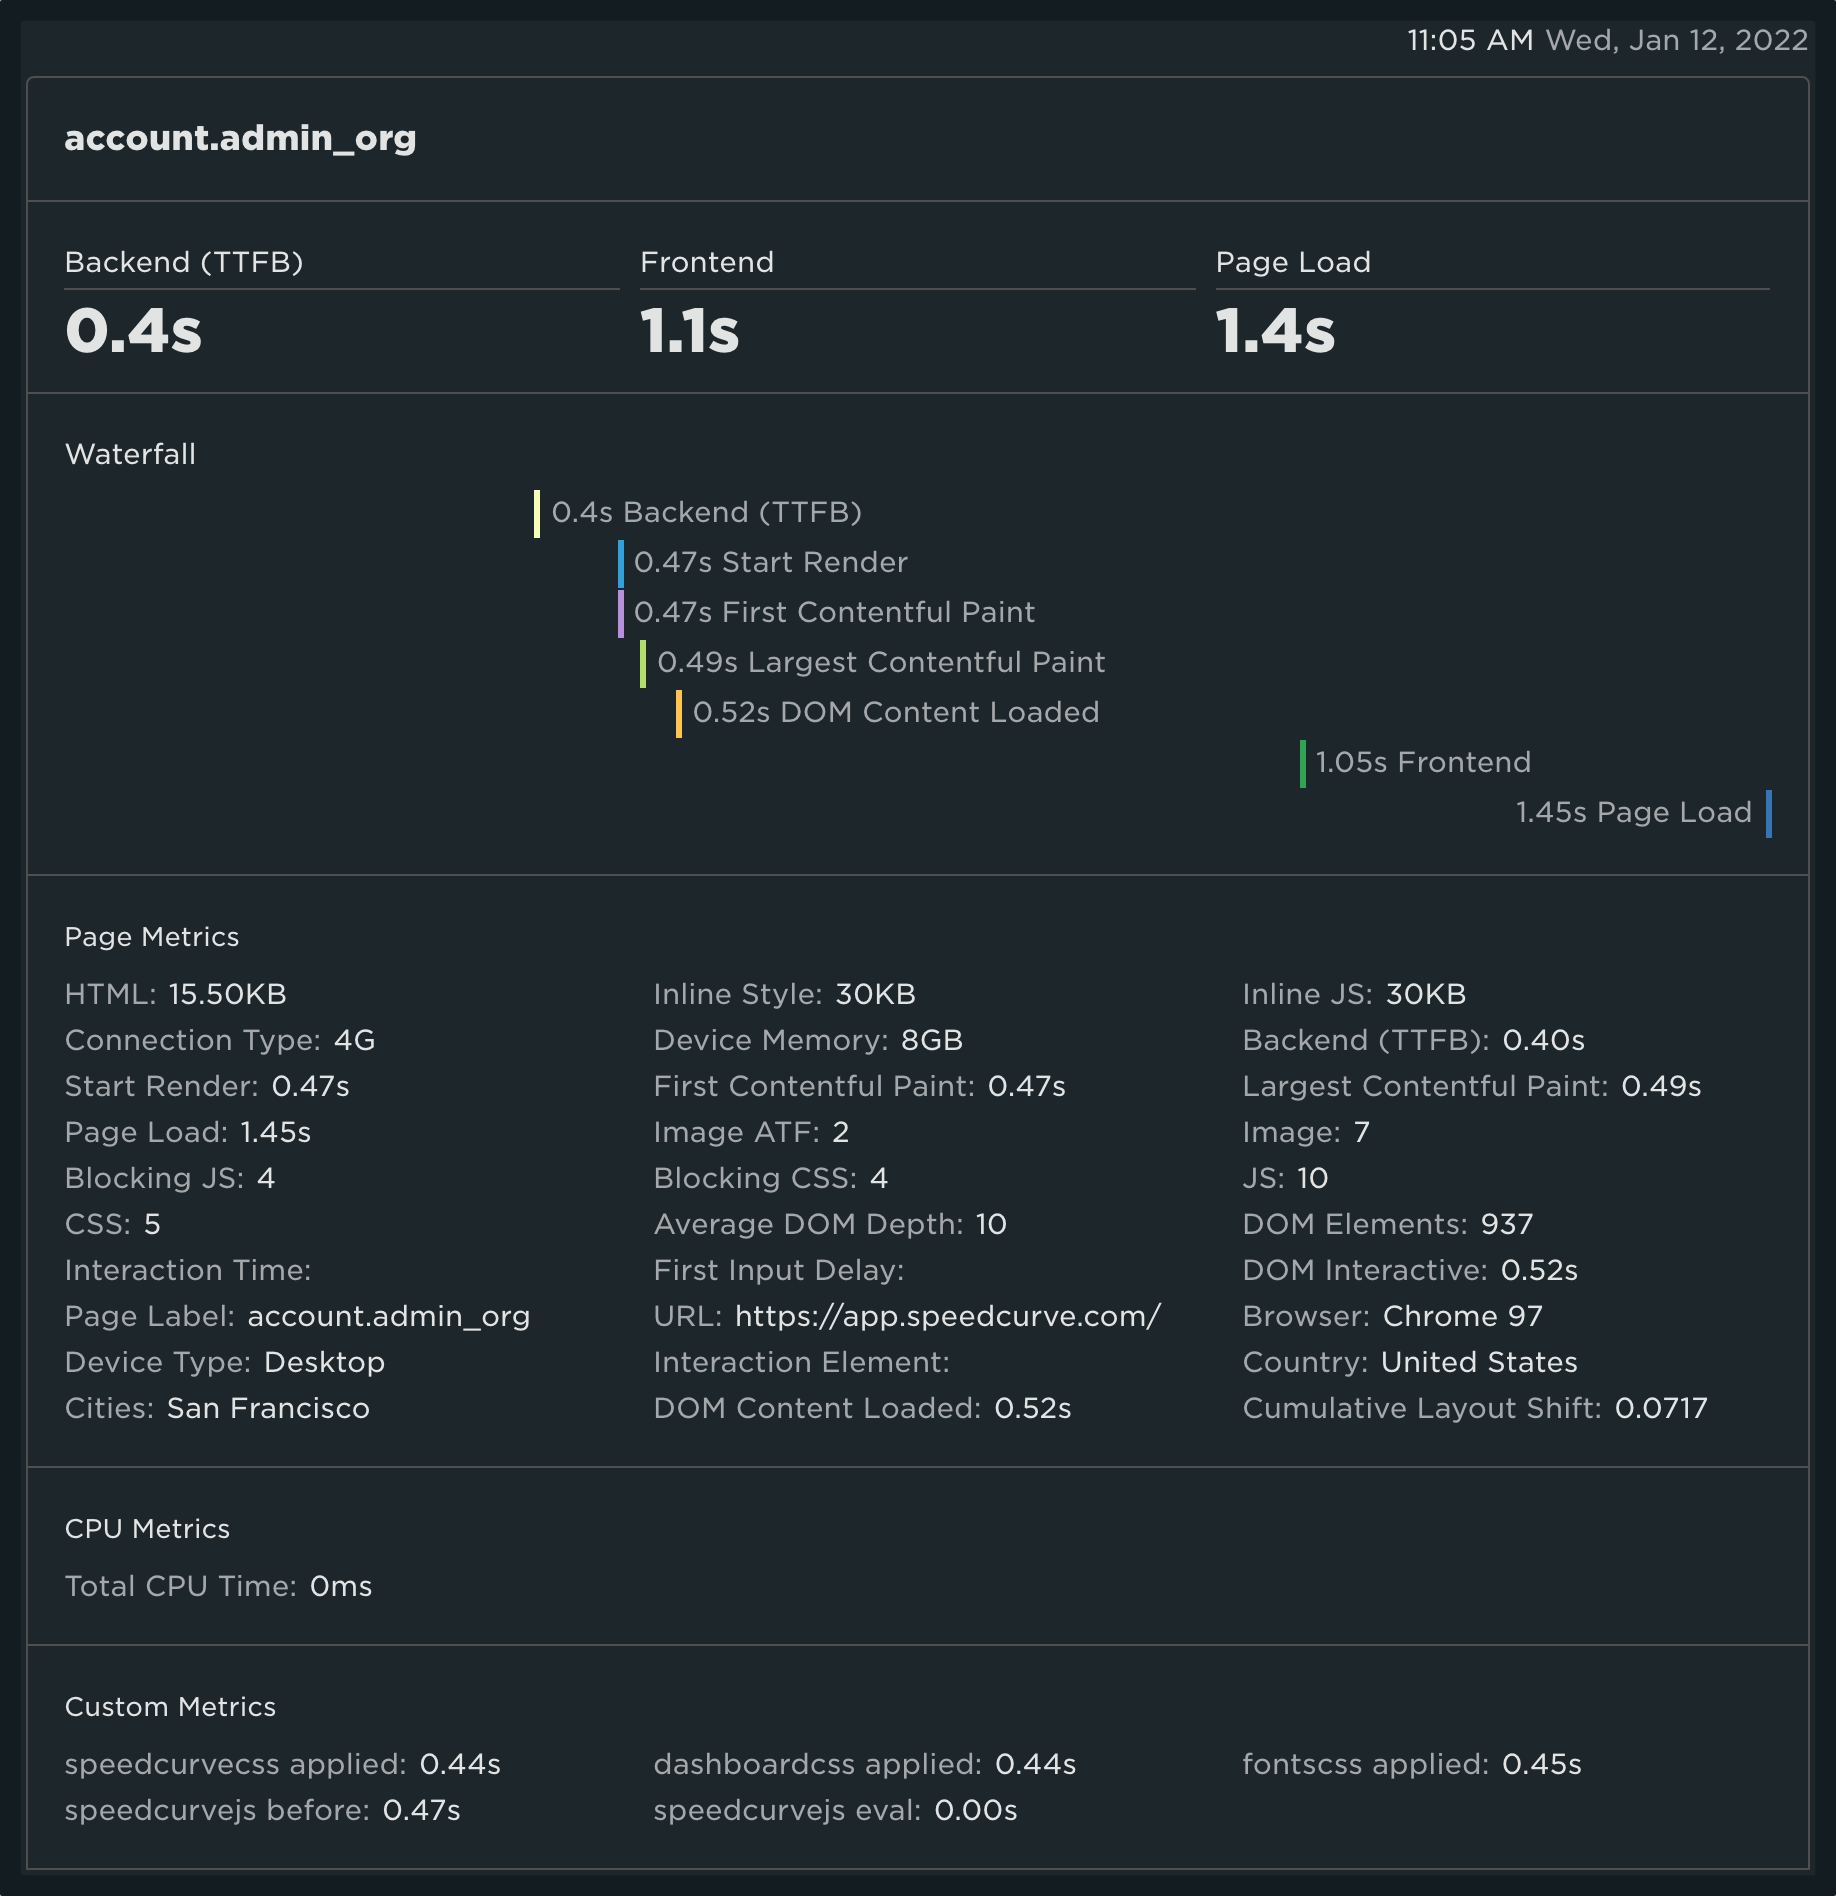
From any one of the listed sessions in the table, you can click through to look at the details, including the user's journey and the page level performance across all collected metrics. (Note that SpeedCurve RUM does not collect personal identifiable information (PII). Learn more about the data that our RUM does and does not collect.)
Page Views
Are things working as expected? Did my most recent change to RUM take effect? Am I collecting any data? Are my new custom metrics working as expected? Sometimes, you just need to look at your data. The Page Views dashboard allow you to do just that.
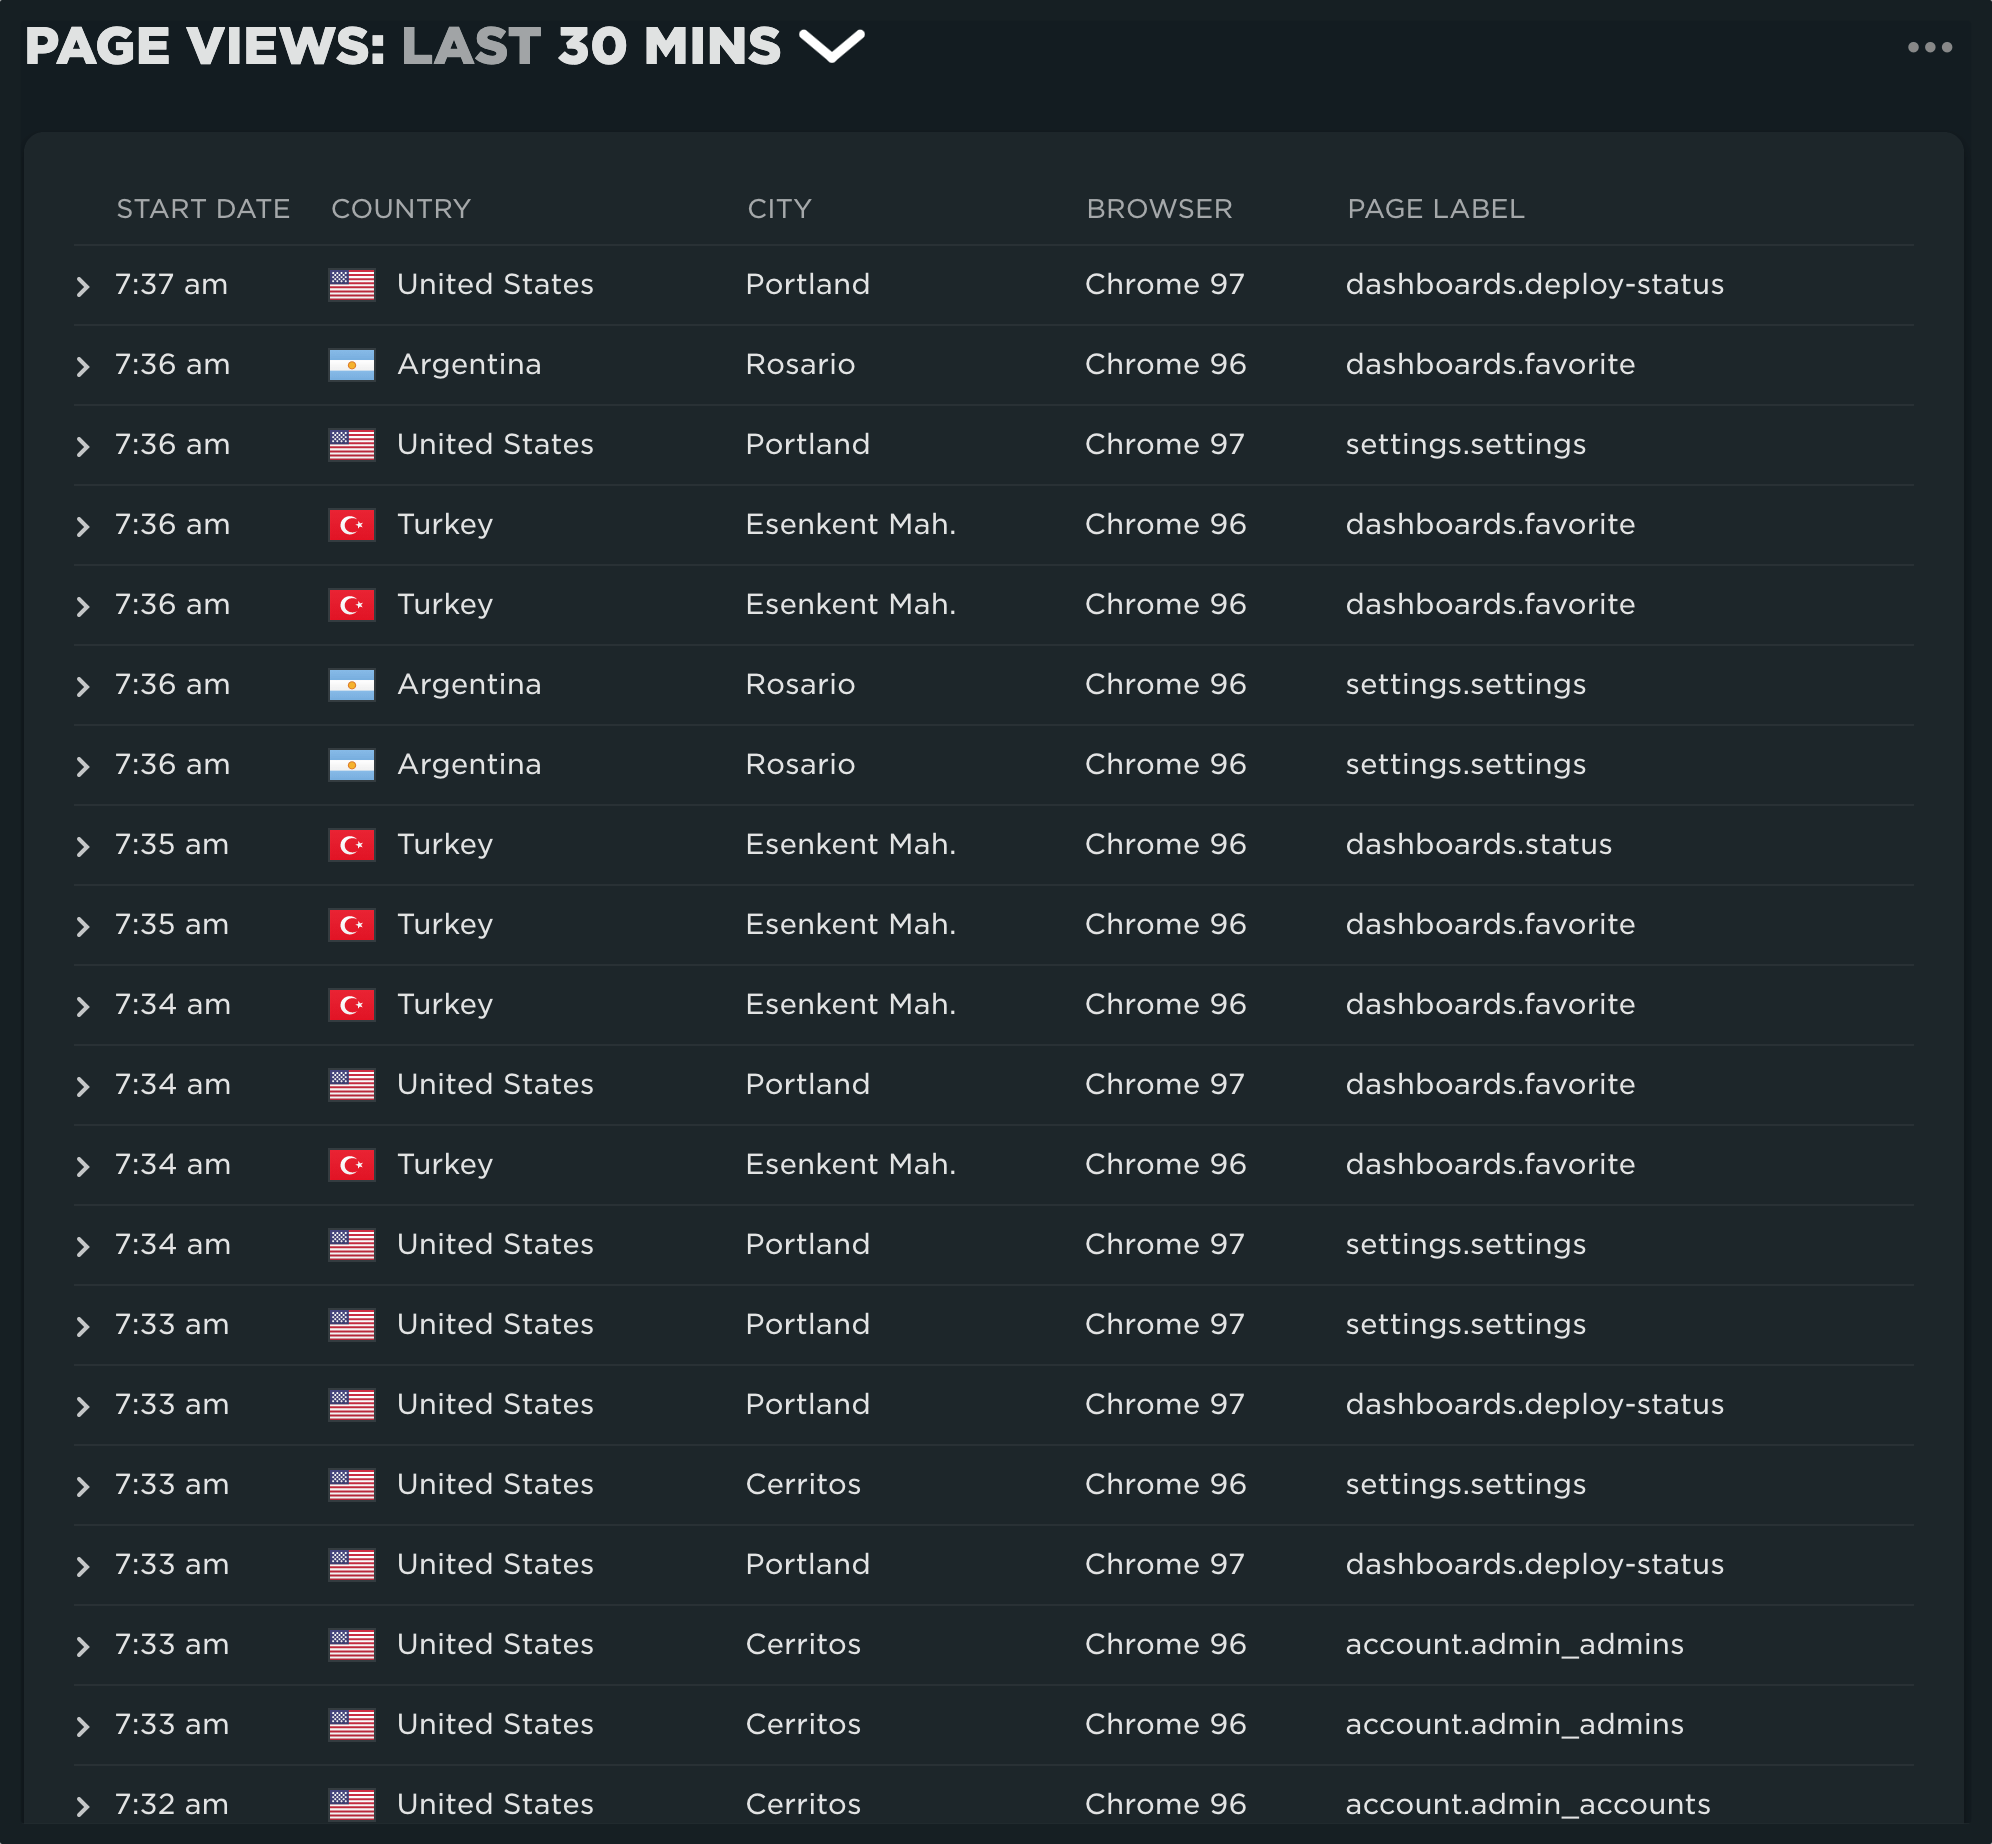
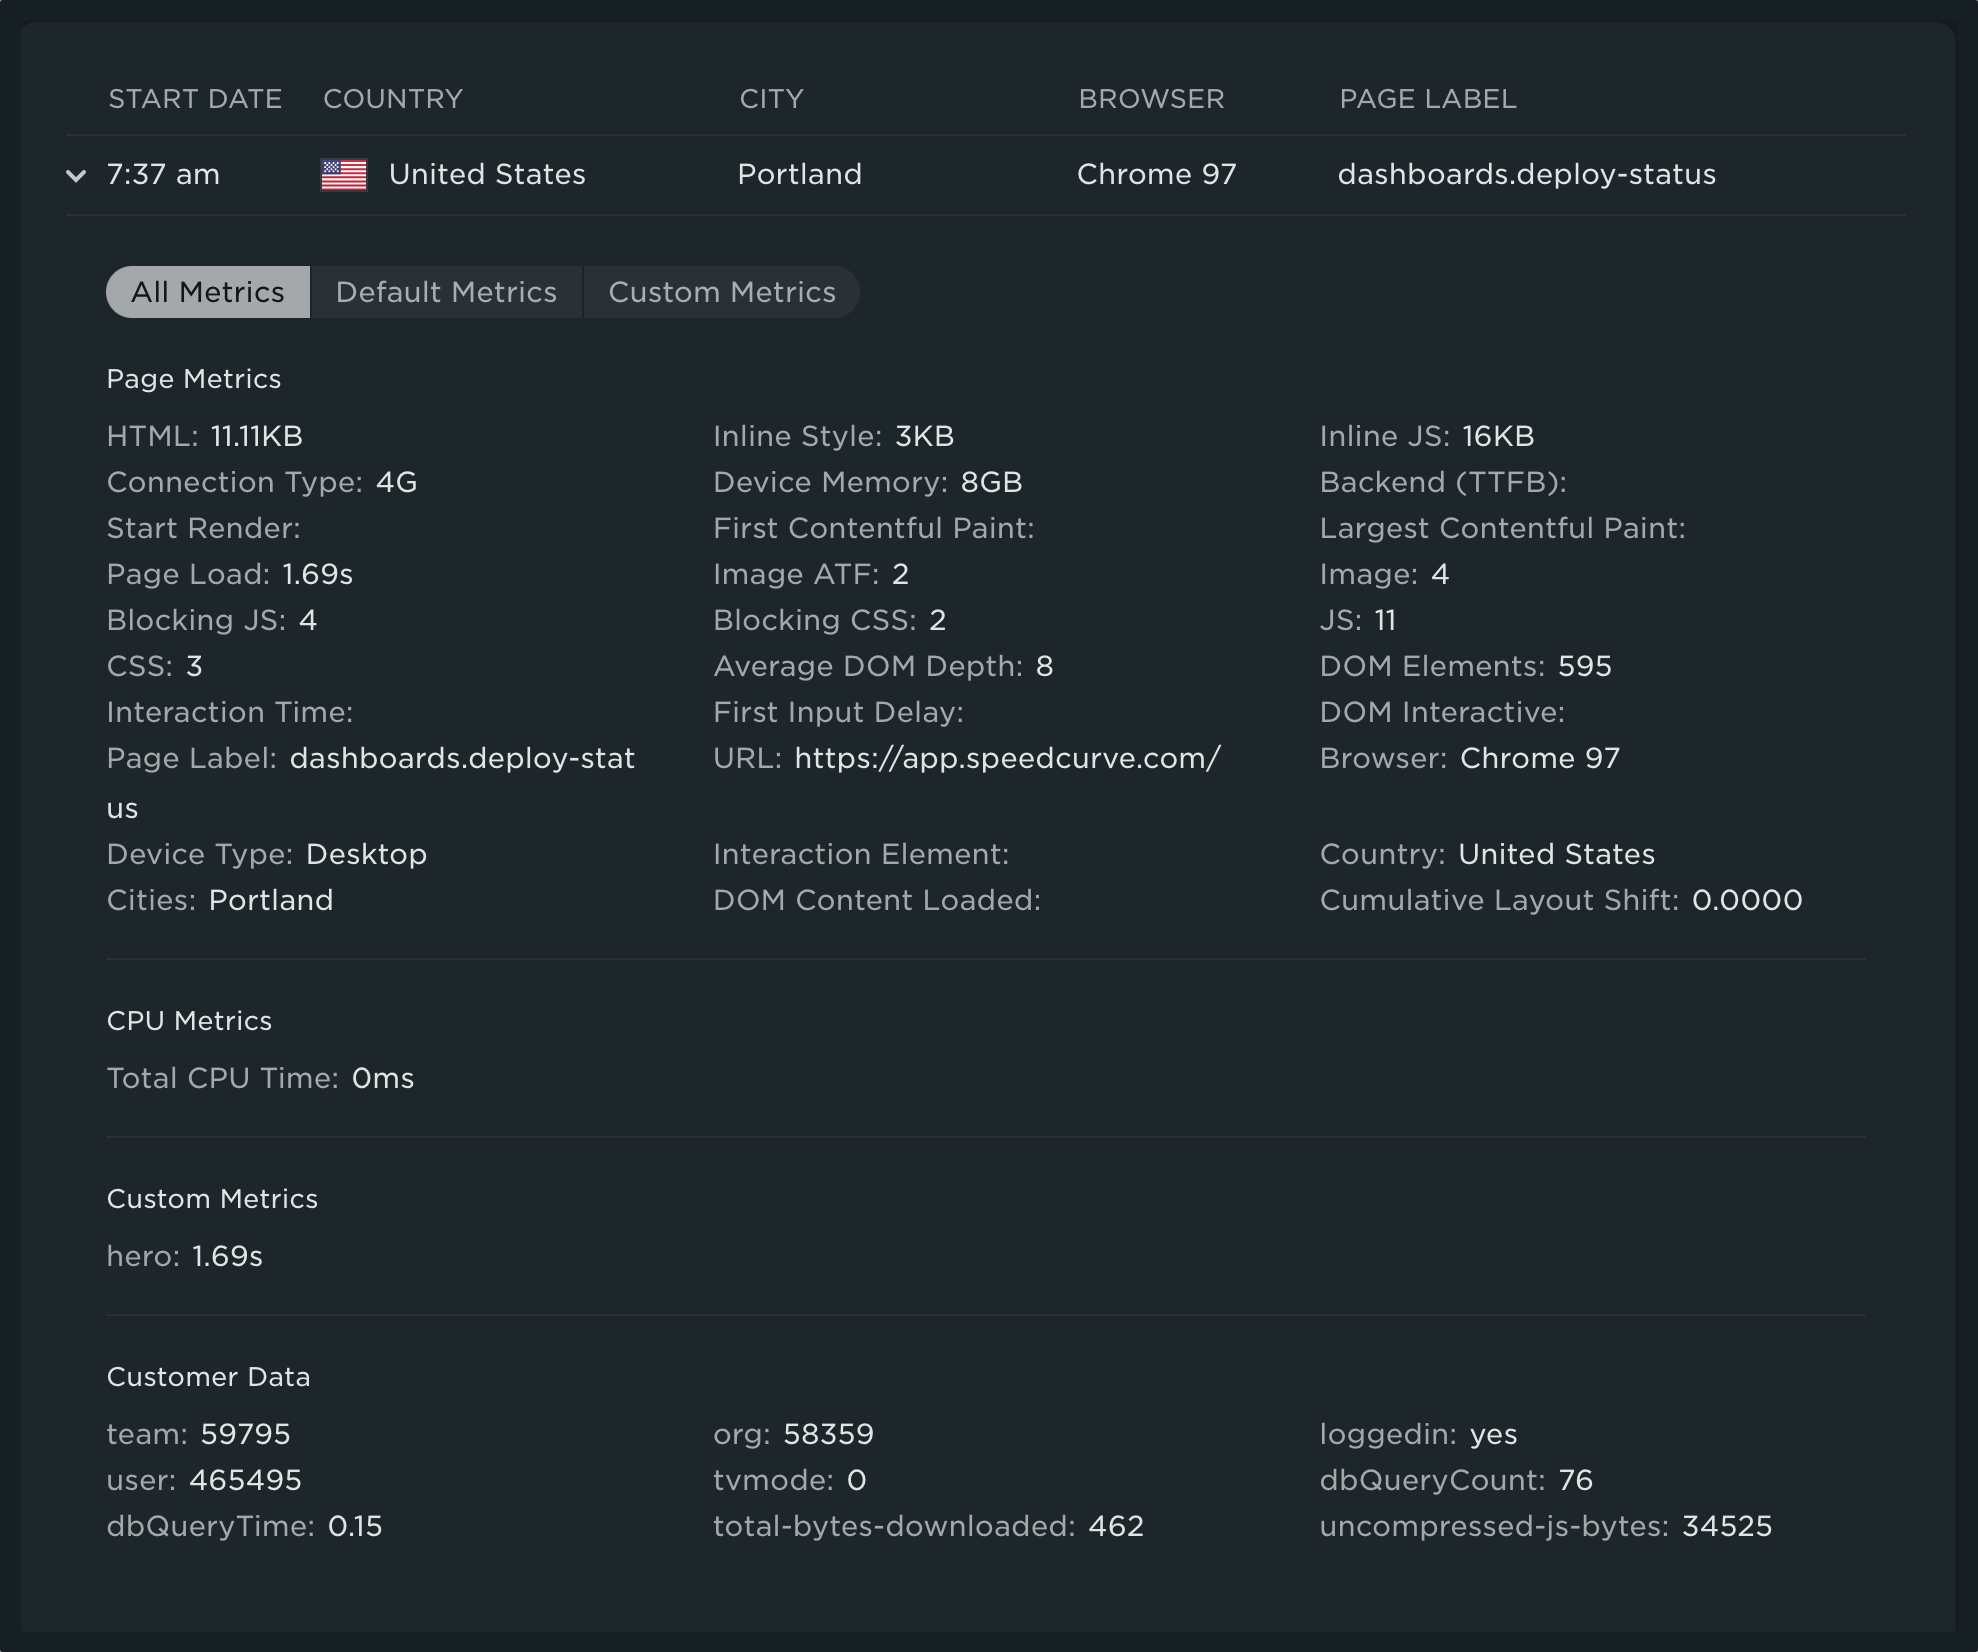
By drilling into any of the summarized entries in the table, you'll find everything we know about that page view. This includes both default and custom metrics as well as any custom data you've defined.
There was at least one good thing about 2021
We hope you enjoy all the new features we've added to RUM over the last year. It's exciting for us to continue to push the boundaries of what we can do with real user data and see firsthand how it helps our customers. In case you are wondering, 2022 has even more RUM goodness in store! As always, feedback is welcomed and encouraged.
Not a RUM user? Start a free trial today!
Read Next

See how customers are using SpeedCurve to make their sites faster.

See industry-leading sites ranked on how fast their pages load from a user's perspective.