
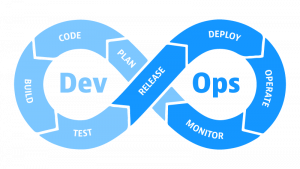
Congratulations! You have set up a DevOps practice. Now, with the hard work done and DevOps metrics and DevOps KPIs in place, you can sit back, relax, and witness the collaboration between your Dev and Ops teams as they deliver better quality software faster.
If only it were that easy.
Why are metrics important in DevOps?
As we look at today’s applications, microservices, and DevOps teams, we see leaders are tasked with supporting complex distributed applications using new technologies spread across systems in multiple locations. Because of this, the way we measure and understand critical services and applications has also changed.
What are DevOps metrics?
DevOps metrics and DevOps KPIs are essential for ensuring your DevOps processes, pipelines, and tooling meet their intended goal. Like any IT or business project, you’ll need to track critical key metrics.
Here are nine key DevOps metrics and DevOps KPIs that will help you meet your goals.
Check out this session from Perform 2023 conference “Complement DORA with Observability to improve engineering happiness”
What are the four main DevOps metrics? DORA’s Four Keys
Let’s start with the four most common metrics Google’s DevOps Research and Assessment (DORA) team established known as “The Four Keys.” Through six years of research, the DORA team identified these four key metrics as those that indicate the performance of a DevOps team, ranking them from “low” to “elite,” where elite teams are twice as likely to meet or exceed their organizational performance goals. Let’s dive into how these DevOps KPIs can help your team perform better and deliver better code.
1. Deployment frequency
Deployment frequency measures how often a team successfully releases to production.
As more organizations adopt continuous integration/continuous delivery (CI/CD), teams can release more frequently, often multiple times per day. A high deployment frequency helps organizations deliver bug fixes, improvements, and new features more quickly. It also means developers can receive valuable real-world feedback more quickly, which enables them to prioritize fixes and new features that will have the most impact.
Deployment frequency measures both long-term and short-term efficiency. For example, by measuring deployment frequency daily or weekly, you can determine how efficiently your team is responding to process changes. Tracking deployment frequency over a longer period can indicate whether your deployment velocity is improving over time. It can also indicate any bottlenecks or service delays that need to be addressed.
2. Lead time for changes
Lead time for changes measures the amount of time it takes for committed code to get into production.
This metric is important for understanding how quickly your team responds to specific application-related issues. Shorter lead times are generally better, but a longer lead time doesn’t always indicate an issue. It could just indicate a complex project that naturally takes more time. Lead time for changes helps teams understand how effective their processes are.
To measure lead time for changes, you need to capture when the commit happened and when deployment happened. Two important ways to improve this metric are to implement quality assurance testing throughout multiple development environments and to automate testing and DevOps processes.
3. Change failure rate
Change failure rate measures the percentage of deployments that result in a failure in production that requires a bug fix or roll-back.
Change failure rate looks at how many deployments were attempted and how many of those deployments resulted in failures when released into production. This metric gauges the stability and efficiency of your DevOps processes. To calculate the change failure rate, you need the total count of deployments, and the ability to link them to incident reports resulting from bugs, labels on GitHub incidents, issue management systems, and so on.
A change failure rate above 40% can indicate poor testing procedures, which means teams will need to make more changes than necessary, eroding efficiency.
The goal behind measuring change failure rate is to automate more DevOps processes. Increased automation means released software that’s more consistent and reliable and more likely to be successful in production.
4. Mean time to restore service
Mean time to restore (MTTR) service measures how long it takes an organization to recover from a failure in production.
In a world where 99.999% availability is the standard, measuring MTTR is a crucial practice to ensure resiliency and stability. In the case of unplanned outages or service degradations, MTTR helps teams understand what response processes need improvement. To measure MTTR, you need to know when an incident occurred and when it was effectively resolved. For a clearer picture, it’s also helpful to know what deployment resolved the incident and to analyze user experience data to understand whether service has been restored effectively.
For most systems, an optimum MTTR could be less than one hour while others have an MTTR of less than one day. Anything that takes more than a day could indicate poor alerting or poor monitoring and can result in a larger number of affected systems.
To achieve quick MTTR metrics, deploy software in small increments to reduce risk and deploy automated monitoring solutions to preempt failure.
Want to learn more about DevOps?
Streamline the way IT operates and enterprises grow with observability and AIOps. Read our DevOps eBook – A Beginners Guide to DevOps Basics
Five supplemental DevOps KPIs
DORA’s Four Keys make a good foundation to improve the performance of your development practices, but they are only a start. Here are five more DevOps KPIs to help your team perform more optimally.
5. Defect escape rate
Defect escape velocity measures the number of bugs that “escape” testing and are released into production.
This metric helps you determine the effectiveness of your testing procedures and the overall quality of your software. A high defect escape rate indicates processes need improvement and more automation, and a lower rate (preferably close to zero) indicates a well-functioning testing program and high-quality software.
To gain visibility into this metric, you need to track all defects found in your released code and software. This means looking at defects in development/QA and in production so you get insight into any defects that got through to production from development and QA. In general, organizations should strive to find 90% of defects in QA before a release hits production.
6. Mean time to detect
Mean time to detect (MTTD) measures the average time between when an incident starts and when it’s discovered.
Of the other DevOps metrics, this measurement helps determine the effectiveness of your monitoring and detection capabilities in support of system reliability and availability. Measuring MTTD is influenced by other DevOps KPI metrics, including mean time to failure (MTTF) and mean time to recovery (MTTR). To calculate MTTD, add all the incident detection times for a given team or project and divide by the total number of incidents.
The challenge of MTTD is having accurate knowledge of when an IT incident starts, which requires the ability to analyze and evaluate historical infrastructure KPI data.
7. Percentage of code covered by automated tests
Percentage of code covered by automated tests measures the proportion of code subject to automated testing.
Automated testing generally indicates greater code stability, although manual testing can still play a role in software development. A higher percentage of code covered by automated testing is the goal, although it is healthy to always have some broken tests–it is important that teams write code to work as intended, not just to pass tests.
8. App availability
Application availability measures the proportion of time an application is fully functioning and accessible to meet end-user needs.
A highly available system is designed to meet the gold standard KPI of five 9s (99.999%). To accurately measure application availability, first make sure you can accurately measure the true end-user experience, not just network statistics. While teams don’t always expect downtime, they often plan for it because of maintenance. Planned downtime makes communication between DevOps and SRE team members crucial to resolve unforeseen failures and ensure both the frontend and backend operate seamlessly.
9. Application usage and traffic
Application usage and traffic monitors the number of users accessing your system and informs many other metrics, including system uptime.
Once you’ve deployed your software, you’ll want to know how many users are accessing your system and the number of transactions occurring to ensure everything is operating normally.
For example, if your application gets too much traffic and usage, it could fail under the pressure. Similarly, these metrics can be useful for indirect feedback on deployments – new and existing. If there’s a dip in usage and/or traffic, this could be feedback that a change you’ve made hasn’t been well received by the end-user.
Having DevOps KPIs such as these application usages and traffic metrics allows you to see if something is wrong and when, for example, there’s a strange spike in traffic or other abnormal usage or traffic metrics. Similarly, you can monitor usage and traffic against microservices that are specifically supporting critical applications. As a result, your DevOps team can use these metrics to ensure systems operate as they should and to take the appropriate action, for example, revert to a previous version to keep end-users happy.
How to monitor DevOps metrics and KPIs for cloud resources and distributed systems
A successful DevOps practice requires teams to monitor a consistent and meaningful set of DevOps KPIs to ensure that processes, pipelines, and tooling meet the intended goal of delivering better software faster.
To help teams gain visibility into DevOps tools and processes, Dynatrace provides automatic full-stack observability into multi-cloud environments. Dynatrace DevOps solutions automatically makes sense of data from across the DevOps life cycle with AI at its core — from development to production. This ability to provide precise answers and integrate with more than 500 technologies enables teams to customize and fine-tune DevOps metrics, automate more DevOps processes, and drive greater efficiency for great user experiences.


Looking for answers?
Start a new discussion or ask for help in our Q&A forum.
Go to forum