
As you know, applications are becoming exponentially more complex and dynamic thanks to cloud, containers and microservices. This has some serious implications for those responsible for ensuring application performance and availability:
- Humans can no longer comprehend the entire application from end to end, so you need AI-powered answers.
- It becomes too difficult to stitch together data from disconnected point solutions, so you need a full stack solution that sees everything in context.
- The manual effort to deploy, manage and get value from your traditional monitoring solution is no longer feasible. You need automation every step of the way.
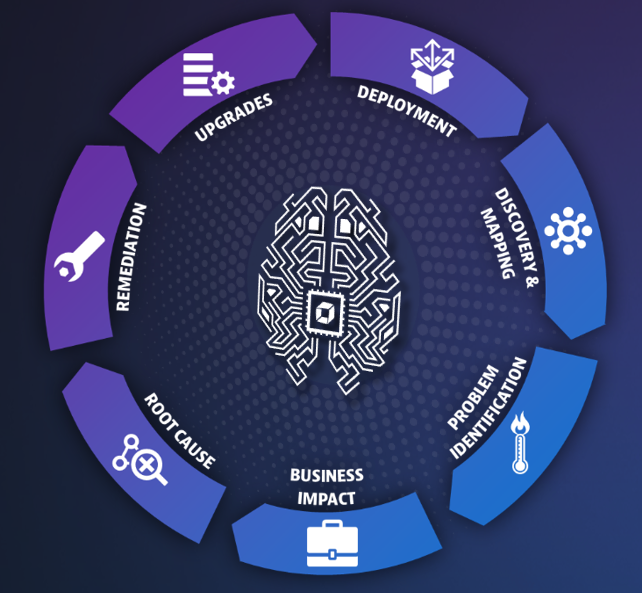
Massive automation is at the heart of the Dynatrace platform and powers every aspect of our monitoring and analytics. Let’s see how.
Deployment, discovery and dependency mapping
With traditional monitoring tools, to fully instrument your application you must understand everything about the app. What are all the components and where do they live? With the complexity of modern apps, this is no simple feat. Not only are there dozens of technologies involved in every transaction, but with the advent of microservices architectures, Kubernetes, and containers your app may look different from one minute to the next.
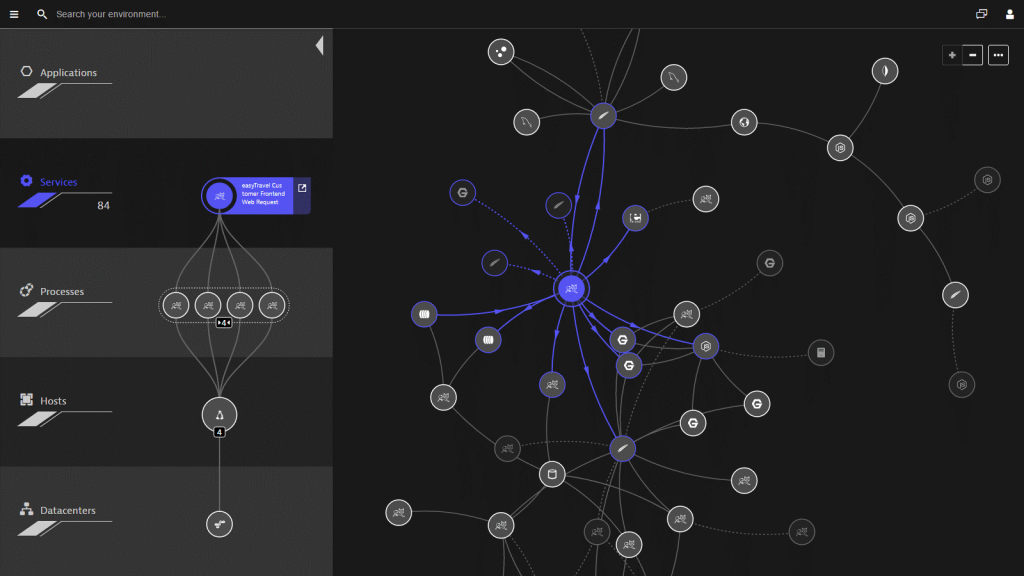
With Dynatrace, the deployment process couldn’t be easier. Simply install OneAgent on your hosts, and that’s it. In minutes, we auto-discover your entire application stack, end-to-end, even those processes running inside containers. Then we you’Re create a three-dimensional map of your environment called Smartscape that shows all the relationships and dependencies, both vertically up and down the stack and horizontally between services, processes and hosts. All of this from just installing a single agent!
Contrast that with older, gen 2 solutions like AppDynamics, where you need multiple components depending on which product features you’re using, and multiple agents depending on which technologies you’re running. Not to mention a different setup if you’re running containers, including modification of images to include the appropriate agent, changes to configuration properties, and creating additional standalone containers to run on host machines. And even after all that, you’re only getting part of the picture. It shouldn’t be so hard!
Advanced baselining, problem identification and business impact
Okay, so you have your environment instrumented (either the easy way with Dynatrace or the hard way with another solution). Now, how do you figure out whether you’re having a problem, and how big that problem is?
With other solutions, you’re going to rely on statistical averages, standard deviations, and sampling to determine normal performance, and then you’ll get alerted when something falls outside of those bounds. The problem is, this approach is too simplistic for today’s environments. It leads to false positives, false negatives, and masks underlying issues. Plus, you’ll have no sense of how important an anomaly is, or which anomalies are related. Congratulations, the alert storm you deal with daily has now turned into an alert typhoon.
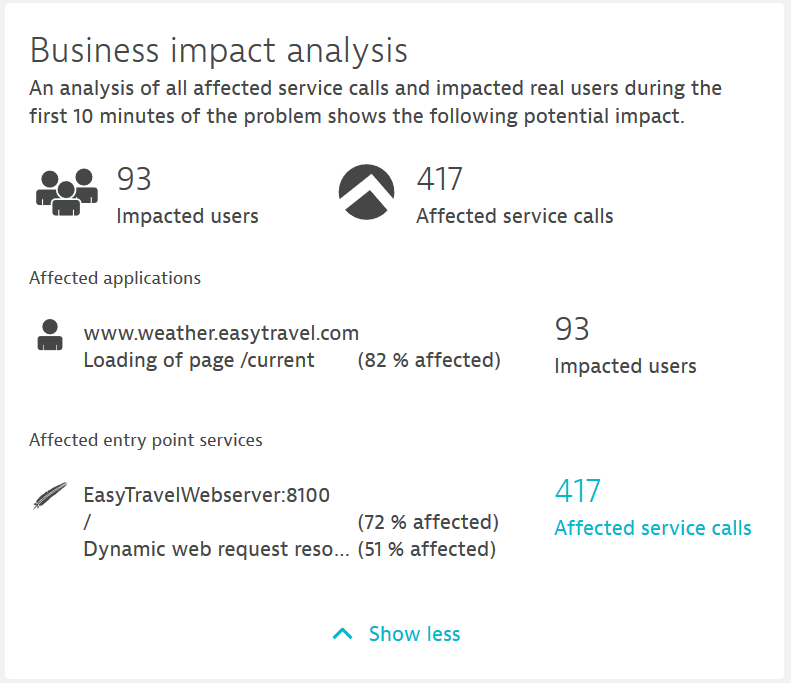
Dynatrace’s approach to detecting problems is much more accurate and useful, and it’s completely automated. We automatically learn what is normal performance and adapt dynamically as your environment changes. Because our AI algorithms understand how everything is related, instead of giving you twenty alerts we give you a single problem. And we automatically show the business impact, so your team can focus on what matters most.
Root cause and remediation
This is all great, but the most important thing is solving the problem, right? Good news – with Dynatrace root cause identification is also fully automated. Because Dynatrace understands all the relationships and dependencies that make up your application, our AI engine can show you with certainty what the root cause of a problem is, and how we found it.
It’s true causation, not correlation like you’ll get with other solutions. Correlation looks at a bunch of disconnected data and tries to make sense of it. It can tell you that a response time slowed down about the same time that a CPU got overloaded, but it can’t tell you whether one caused the other.
Even better than just finding the root cause of a problem, with Dynatrace you can also automate remediation for many issues. When Dynatrace finds a problem, you can have it automatically trigger a remediation task to kick off a job in your continuous delivery tool that can, for example, rollback a deployment to a working state. How cool is that?
Upgrades
Upgrading your APM agents is probably (hopefully!) not the most exciting part of your job. In fact, if you’re using other APM solutions you likely avoid upgrades at all costs, because it means shutting everything down and logging into every host to manually upgrade. And there is never a good time for that. We deploy Dynatrace in environments running outdated AppD agents all the time, because it’s just too painful to keep them up-to-date.
Luckily, we’ve automated this process as well. It’s so easy that you literally need to do nothing. Once you deploy Dynatrace on your hosts, updates just happen. You always have the latest and greatest, no problem.
See for yourself
Seeing is believing. If you’re skeptical about how powerful Dynatrace automation really is, or just curious, it’s easy to try it yourself.


Looking for answers?
Start a new discussion or ask for help in our Q&A forum.
Go to forum