
The newly released Dynatrace GitHub Action enables DevOps teams to fully leverage all available observable information from CI pipelines. By leveraging CI pipeline information within your observability platform, your DevOps teams can closely monitor the health of all pipelines and react faster when critical incidents are detected. This makes deployment outages much easier to detect and remediate.
GitHub Actions offer a great way to automate, customize, and execute your software development workflows. A fully automated software release pipeline helps you release new functionally faster and frees up precious developer resources to focus on innovation. GitHub workflows can be quite complex, executing dozens of individual build, test, and deployment steps. By dropping a Dynatrace GitHub Action into your GitHub CI/CD workflow you gain observability and real-time insights into the performance of your pipeline. The backflow of CI/CD workflow information also helps your DevOps teams quickly find faulty software deployments and react quickly to prevent and remediate critical outages.
What is a GitHub Action?
GitHub Actions are configurable workflow steps that can be used to perform any kind of automation task. Examples of such automation tasks include checking out a repository, building some software, signing the resulting binary, and, finally, copying and deploying the resulting software artifacts to a cloud runtime environment.
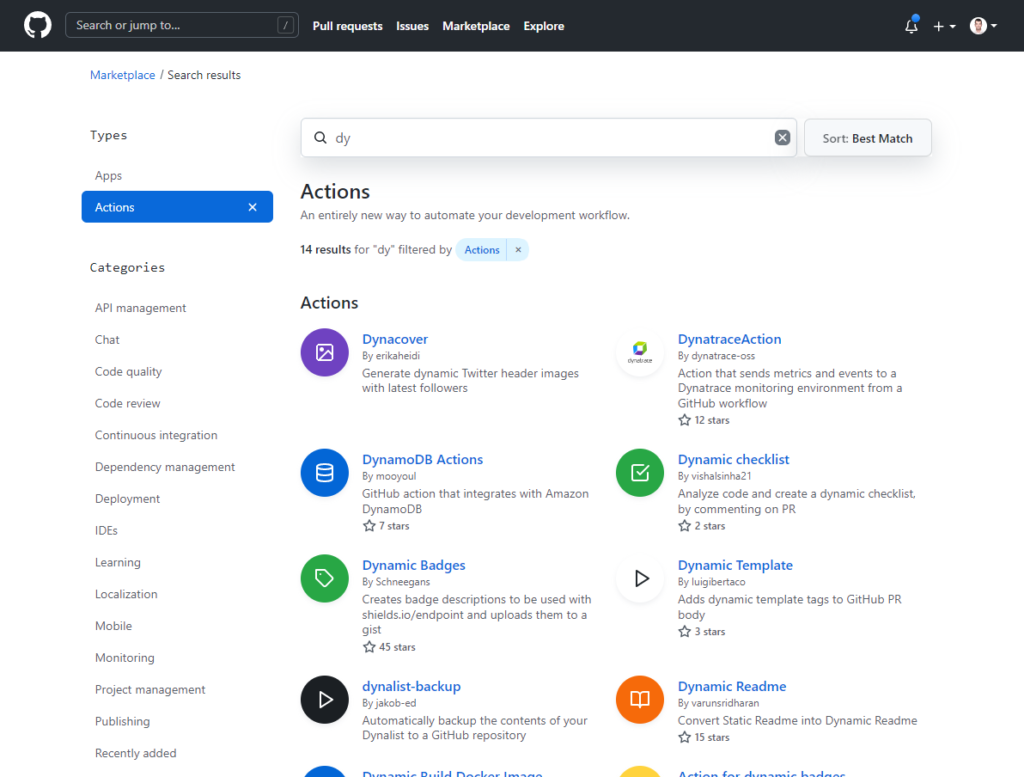
A series of such actions can be combined into a GitHub workflow that can be triggered whenever new code is committed or when a new release tag is pushed to a repository. Multiple GitHub Actions are available within the GitHub Marketplace:
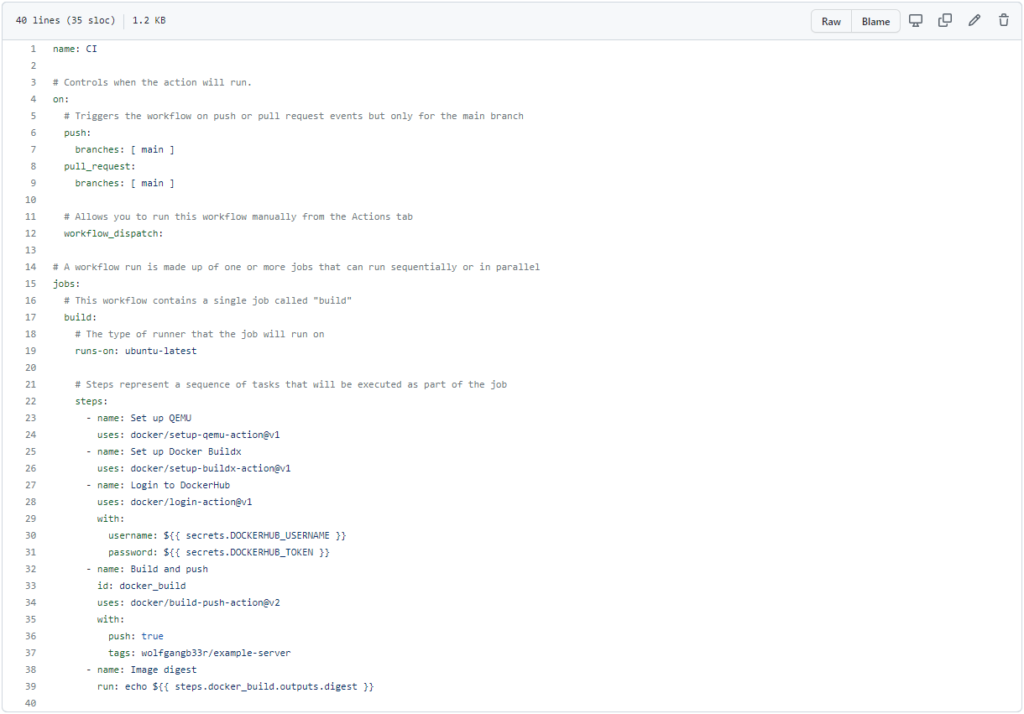
With a single click, you can select a GitHub Action that begins building a Docker container from your repository and automatically deploys the resulting image to Docker Hub. The workflow is configured to run automatically whenever any push or pull request is made on the main branch, or when the workflow is triggered manually.
As you can see below, all that’s needed to automatically build and deploy a container on Docker Hub is a 40-line YAML workflow configuration file:
Dynatrace GitHub Action
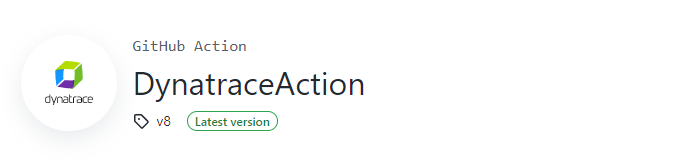
The purpose-built Dynatrace GitHub Action is available on the GitHub Marketplace in the monitoring category. It’s useful for seamlessly observing all your GitHub workflows. Simply drag and drop the Dynatrace Action into your CI pipeline and collect all your relevant metrics and events during each of the execution steps.
This GitHub Action is part of the Dynatrace Open Source Initiative, which maintains and contributes to numerous open source projects.
What‘s the value of observing your CI/CD pipeline in Dynatrace?
Collecting insights about your CI/CD pipeline comes with many benefits. Collecting statistics about the execution of your build and deployment automation workflow helps you evaluate the overall quality of your pipeline.
Counting the number of failing builds versus the number of successful builds helps you understand why and when code commits break your pipeline. Counting the number of failing integration tests helps to inform the responsible dev teams early so that they can prevent critical issues from reaching production.
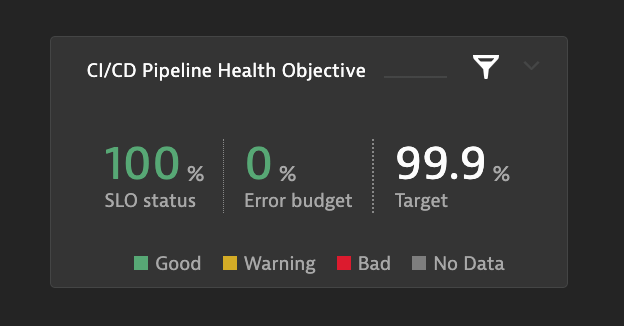
A Service Level Objective (SLO) can be defined to help keep track of the quality of your build and test pipeline, as shown below:
Integrate workflow information within Dynatrace Davis root-cause detection
Besides collecting continuous health information about all your build pipelines, it’s also crucial that you have the ability to quickly identify when a faulty deployment is the root cause of a large-scale incident in production.
By seamlessly feeding your pipeline health metrics and event information back to your Dynatrace monitoring environment, Dynatrace Davis AIOps can pick up and evaluate that information in case of detected incidents.
One use-case is to send all relevant deployments to the monitoring platform and to attach that information to all affected services. Below you can see a Dynatrace GitHub Action configuration that counts the number of failing and successful builds. The Action sends a deployment event to Dynatrace with each pipeline execution.
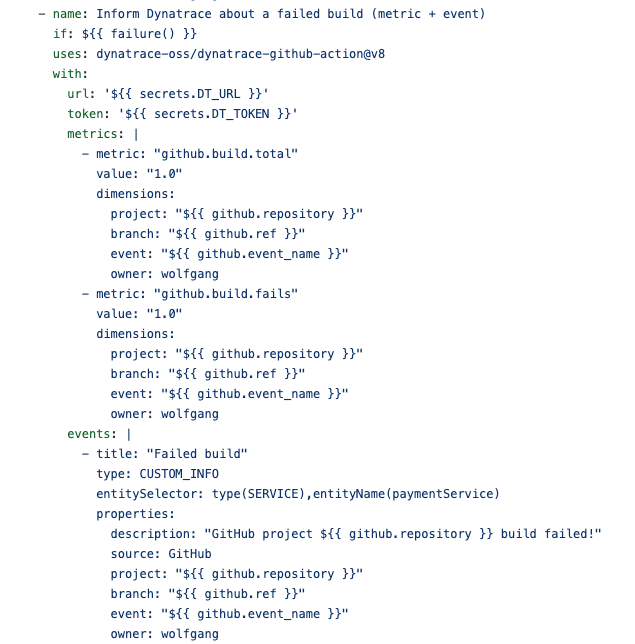
Each of the executions now automatically informs Dynatrace of the new deployment, attaching the information to all services that are named ‘loginService’. The relevant information is then shown on the service’s overview page in the Dynatrace web UI. In case of an incident, the Davis AIOps engine automatically picks up the metric and identifies the deployment event as the root cause of the issue.
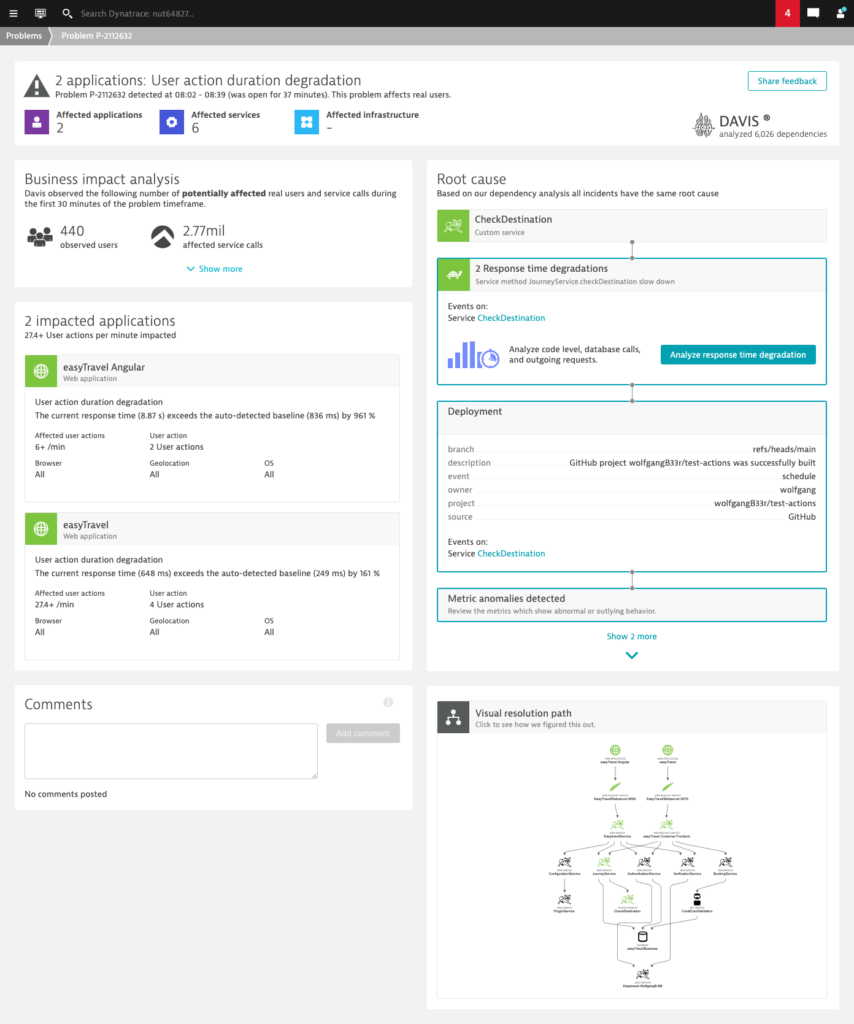
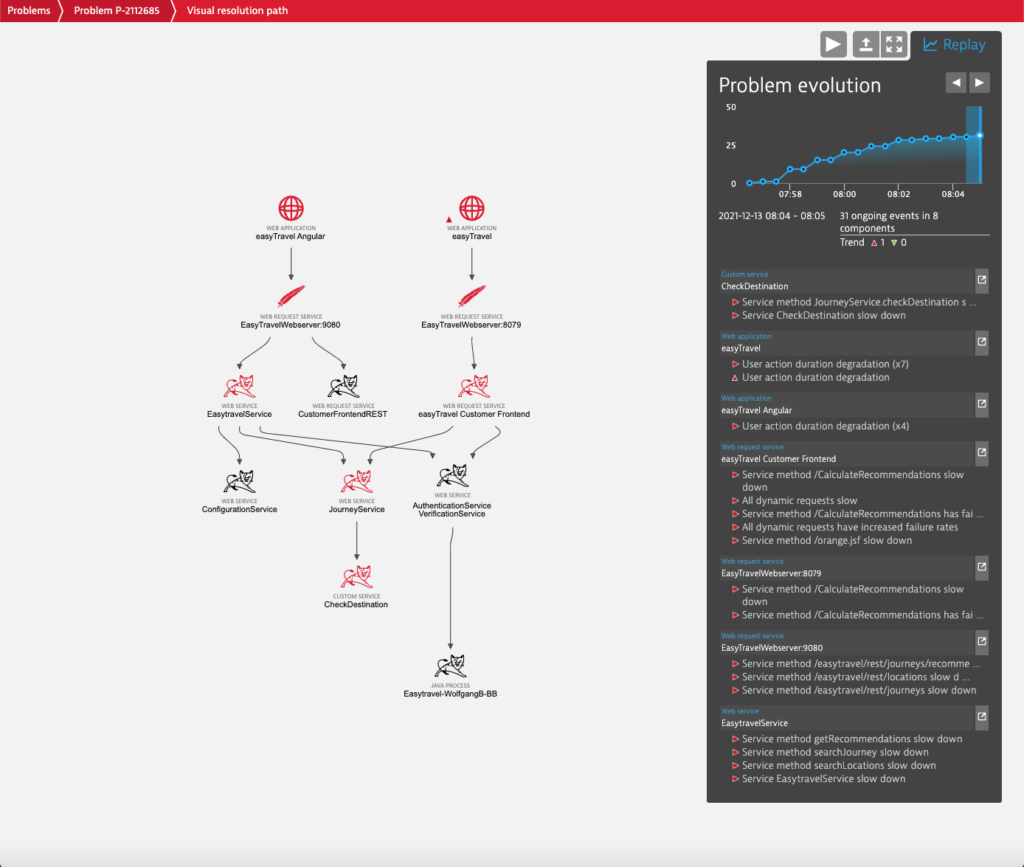
See the example below which shows that Davis AIOps has identified a new service deployment triggered by the GitHub CI pipeline as the root cause of a slowdown in production.
New to Dynatrace?
If you haven’t used Dynatrace yet, try it out by starting your Dynatrace free trial today.


Looking for answers?
Start a new discussion or ask for help in our Q&A forum.
Go to forum