
Dynatrace has recently enhanced its Metrics APIs, allowing everyone to send any type of metric with any set of data dimension to Davis®, Dynatrace’s AI engine. In the recent blog post, Wolfgang Beer, Technical Product Manager at Dynatrace, goes into detail about how that API is also used to ingest data from StatsD, Telegraf, or Prometheus, how these metrics can be assigned to the Smartscape topology, and how Davis can alert on anomalies of these custom metrics and give you root cause information thanks to understanding how these metrics are connected to the rest of your infrastructure.
There are many use cases for using this API. In this blog, I want to give you two examples of internal innovation projects at Dynatrace which leverage this new API, to truly show you the power – and the fun-ness of this new metric ingest 😊
All your JMeter results in Dynatrace for better performance engineering
Christian Inzko, Performance Engineer out of our Klagenfurt Lab, is running a lot of performance tests to validate performance and scalability of our Dynatrace clusters. For some of these tests, he’s using the open source tool Apache JMeter. In a conversation I had with Christian a couple of weeks back, we realized that pushing JMeter metrics directly to the Dynatrace Platform would make his life as performance engineering much easier as all his data would be in one place to analyze. Up until then, he had pushed JMeter data in other tools which made it harder to correlate it with the rest of the performance data captured by Dynatrace OneAgent.
In our conversation, I mentioned the new Dynatrace Metrics ingestion and off we went. 😊 A day later he came back to me as he just built, and since then also open sourced, the Dynatrace Backend Listener for JMeter! That JMeter extension pushes JMeter metrics into Dynatrace using the new Metric Ingest API. If you happen to use JMeter you can try this yourself by adding the extension to your JMeter installation (copy it to the lib/ext directory) and then using the Dynatrace Backend Listener to stream metrics from your JMeter test execution to Dynatrace. If you don’t have Dynatrace simply sign up for the SaaS Trial and give it a go! Now you have your JMeter metrics in Dynatrace alongside your full stack monitoring metrics captured by OneAgent:
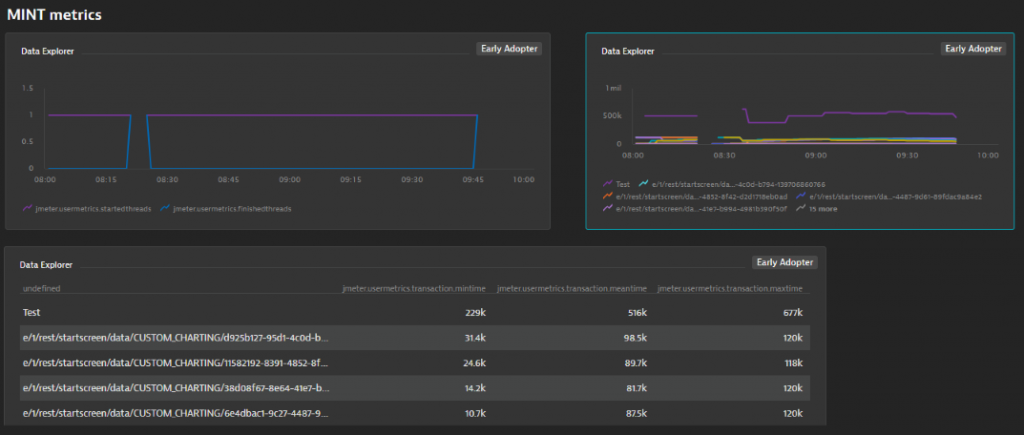
This integration ensures that performance data from testing tools such as JMeter is in the same place as all other relevant performance and infrastructure data. With the rich set of features in Dynatrace for diagnostics (check out my Advanced Diagnostics with Dynatrace YouTube Tutorial) it speeds up analysis and diagnostics for Christian significantly.
I’m sure I’ll cover this integration with JMeter more in the upcoming blogs and tutorials as we have a strong performance engineering community that uses Dynatrace. So stay tuned.
Now – while this on its own is a great story, I wanted to cover another story that Christian shared with me. This one came out of a planned on-site innovation day project earlier this year but turned into a COVID-19 home innovation project:
From UFOs to temperature and infrared related metrics
The idea was inspired by an innovation day project of our lab in Klagenfurt. The team wanted to monitor the gaming room (to detect if it is free or not) and show the status with a Dynatrace UFO on each floor.
First, they used a video camera and trained an AI model but then decided to use a less privacy-intrusive variant with an infrared sensor. Unfortunately, they couldn’t try this approach during the innovation day because at this time COVID-19 started and the gaming room was closed to ensure social distancing rules. Therefore, Christian decided to try something similar at home with a temperature and infrared sensor. For all the hardware geeks – here is the architectural overview of his project:
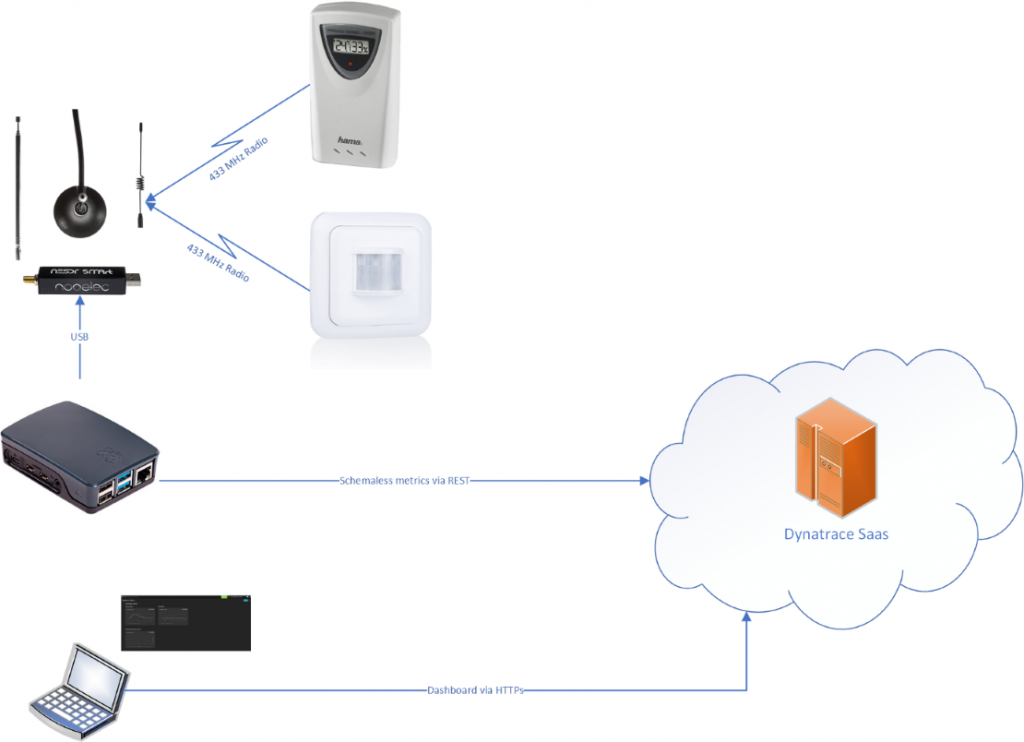
If you want to replicate Christians work – here are the software and hardware specs:
Hardware
- Raspberry Pi Model 3 B
- RTL-SDR (Software Defined Radio) with Antenna and USB Adapter (“Nooelec NESDR SMArt v4 Bundle”)
- 433 MHz Outdoor Temperature and Humidity Sensor (“Hama TS33C”)
- 433 MHz Infrared Sensor (“Smartwares SH5-TSO-A”)
Software
- Raspbian GNU/Linux 10 (Kernel Linux 5.4.51-v7+)
- Python 3.7.3
- rtl_433 (https://github.com/merbanan/rtl_433)
- Dynatrace
- A self-written python script to grab and parse the output from the rtl_433 process and sends the schemaless results as metrics to Dynatrace
Now for the scripting nerds – A description on what actually happens
The python script starts the rtl_433 software as a subprocess and collects the JSON output. It parses the JSON results and filters for known sensors (temperature, humidity, infrared detection status) and extracts the required info for creating a schema-less metric line (dimensions, values) and adds the metric line to a queue. It also starts a scheduled job which runs every minute and grabs the metric lines from the queue and sends them in one metric request.
Here is a sample result output from rtl_433:
{“time” : “2020-10-11 08:52:58”, “model” : “Nexus-TH”, “id” : 16, “channel” : 1, “battery_ok” : 0, “temperature_C” : 8.300, “humidity” : 92}
{“time” : “2020-10-11 08:53:11”, “model” : “Hideki-TS04”, “id” : 9, “channel” : 2, “battery_ok” : 1, “temperature_C” : 17.300, “humidity” : 57, “mic” : “CRC”}
{“time” : “2020-10-11 08:53:11”, “model” : “Hideki-TS04”, “id” : 9, “channel” : 2, “battery_ok” : 1, “temperature_C” : 17.300, “humidity” : 57, “mic” : “CRC”}
{“time” : “2020-10-11 08:53:11”, “model” : “Hideki-TS04”, “id” : 9, “channel” : 2, “battery_ok” : 1, “temperature_C” : 17.300, “humidity” : 57, “mic” : “CRC”}
{“time” : “2020-10-11 08:53:55”, “model” : “Nexus-TH”, “id” : 16, “channel” : 1, “battery_ok” : 0, “temperature_C” : 8.300, “humidity” : 92}
{“time” : “2020-10-11 08:53:56”, “model” : “Hideki-TS04”, “id” : 9, “channel” : 2, “battery_ok” : 1, “temperature_C” : 17.300, “humidity” : 57, “mic” : “CRC”}
{“time” : “2020-10-11 08:53:56”, “model” : “Hideki-TS04”, “id” : 9, “channel” : 2, “battery_ok” : 1, “temperature_C” : 17.300, “humidity” : 57, “mic” : “CRC”}
{“time” : “2020-10-11 08:53:56”, “model” : “Hideki-TS04”, “id” : 9, “channel” : 2, “battery_ok” : 1, “temperature_C” : 17.300, “humidity” : 57, “mic” : “CRC”}
And here’s what the Python script does with it by translating the data into the metrics line protocol that can be sent to Dynatrace:
Sending lines for metric ingest:
thermometer.temperature,model=Hideki-TS04,channel=2,id=9 17.3 1602398921000
thermometer.humidity,model=Hideki-TS04,channel=2,id=9 57 1602398921000
thermometer.temperature,model=Nexus-TH,channel=1,id=16 8.3 1602398950000
thermometer.humidity,model=Nexus-TH,channel=1,id=16 92 1602398950000
thermometer.temperature,model=Hideki-TS04,channel=2,id=9 17.3 1602398966000
thermometer.humidity,model=Hideki-TS04,channel=2,id=9 57 1602398966000
thermometer.temperature,model=Hideki-TS04,channel=2,id=9 17.3 1602398966000
thermometer.humidity,model=Hideki-TS04,channel=2,id=9 57 1602398966000
thermometer.temperature,model=Hideki-TS04,channel=2,id=9 17.3 1602398966000
thermometer.humidity,model=Hideki-TS04,channel=2,id=9 57 1602398966000
metrics response status: 202, data: {“linesOk”:10,”linesInvalid”:0,”error”:null}
SchedulerJob finished at 2020-10-11 08:49:42.822368 and has send 10 lines
So – the Python script can now either send this via HTTPS to the Dynatrace Metrics API v2 Ingest endpoint on the Dynatrace Cluster / ActiveGate – or – can send it to the localhost endpoint of a Dynatrace OneAgent. This option to either send it to the cluster or to a OneAgent is from my opinion a very elegant solution as it makes it super easy for everyone to send additional metrics to Dynatrace.
Now – once that data is in Dynatrace it can, for instance, be charted:
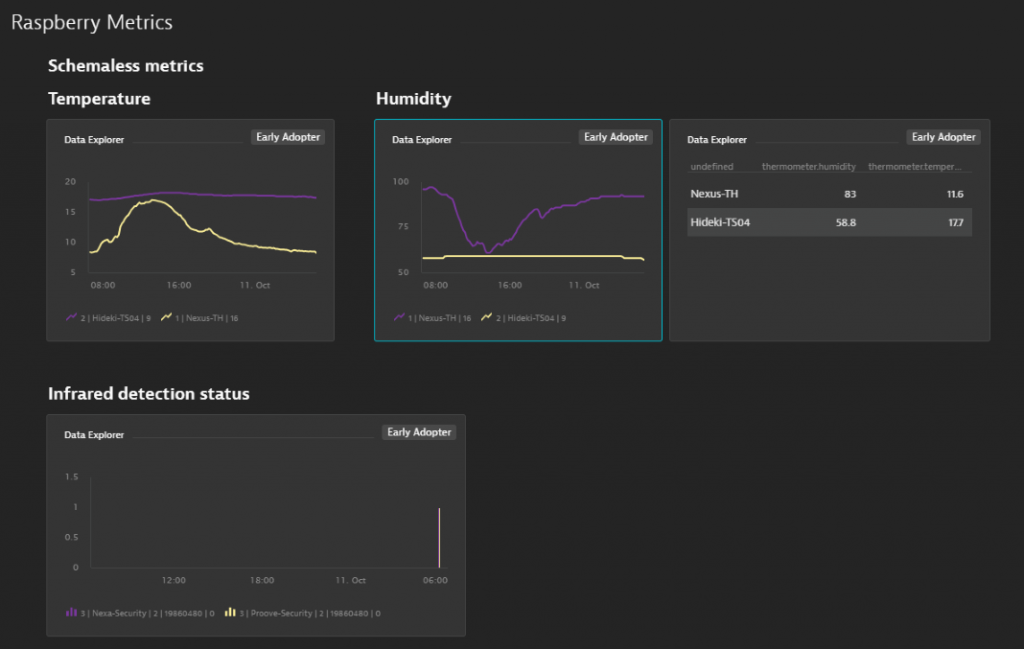
The dashboard screenshot shows data from a day in early October. Seems like the temperature at Christians place is what one would expect early October. Also seems like it rained in the early morning as humidity reached 100%.😊
This data not only looks good on dashboards but can now also be used for alerting, for example, Davis could alert on abnormal temperature or in case humidity spikes too much to inform Christian that it’s wise to use an umbrella. As you can see – the sky is the limit with what is possible!
Next Step: Bring in more metrics and use cases!
I hope the new Metrics Ingest API will inspire more people like Christian to come up with new innovative use cases and data that should make it into Dynatrace. If you have projects like this let us know. Always happy to promote your ideas through the blogs or feature them on one of my Performance Clinic YouTube Tutorials!


Looking for answers?
Start a new discussion or ask for help in our Q&A forum.
Go to forum