
In this article, we will learn how to use Apache JMeter to perform a load test on SQL Server. This test type enables us to measure the application behaviors under specific conditions so that it enables us to observe a variety of resource consumptions (CPU, memory, latency, response times, etc) and it also helps to detect the performance bottlenecks. Database testing can help to find out and identify the problem when the database working under high workloads with multiple users. The database people can identify and fix the performance issues before publishing the database into the production through these tests.
What is Apache JMeter?
JMeter is an Apache project that was originally designed to test web applications but later developed to perform different test functions. JMeter is used to measure and observe the performance of web sites or a variety of services. JMeter enables us to perform the following tests:
- Performance test
- Load test
- Stress test
- Functional test
What is the database load test?
Databases are the crucial factors that affect application performances. Due to the performance of the database, it might be annoying for the users to experience high wait times. Before releasing the database into the live environment, it will be a good idea to test the database performance for multiple users. The result of the test helps to identify the performance bottlenecks. Database load test helps us:
- Determine the database capabilities and reveals hardware or database tuning requirements
- Prevents unexpected problems under the high workloads
- It allows us to save time by pointing out real bugs instead of guessing the problems
We can use the following tools for performing a performance test on the SQL Server:
Starting the Apache JMeter
At first, we will download the Apache JMeter from the Apache Software Foundation web site. We chose apache-jmeter-5.3.zip and start the download.

After unzipping the file, we click the jmeter.bat or ApacheJMeter.jar executables in the bin folder and launch the JMeter.

The main screen of the Apache JMeter meets us.

On this screen, we will add the following elements respectively, and start the test.
- Thread group element
- JDBC connection configuration
- JDBC request
- Summary report
Creating a Thread Group Element
The Thread Group is a set of threads that performs a test scenario. In this screen, we can set the number of users and other similar settings to simulate the user requests. We right-click on the TestPlan and then we select the Add->Threads (Users)->Thread Group

On the Thread Group screen:
- The Number of Threads (users) specifies how many threads will be used in this load test
- Ramp-Up Period (in seconds) specifies how long takes the total number of the threads will be activated. For example, if we set the Number of Threads to 10 and Ramp-Up Period to 30. In this case, the thread number will increase as one for every 3 seconds and at the end of the 30 seconds, 10 threads will be active
- Loop Count specifies the number of times the test will be executed. If we click the Infinite option, the test will run until we stop it

After creating a thread group, we click the diskette icon and save the load test.

Creating JDBC Requests
JDBC request element helps to define a SQL query that will be executed by the test user(s). However, before creating a JDBC request, we need a valid database connection. For this,we right-click on the thread group element and then select the Add->Config Element -> JDBC Connection Configuration.

On this screen, we give a name for the created pool as Test_Pool and then we determine the database connection settings
Database URL : jdbc:sqlserver://localhost;DatabaseName=AdventureWorks2017;
JDBC Driver class :com.microsoft.sqlserver.jdbc.SQLServerDriver
UserName: Database user name
Password: User password

After completing the JDBC Connection Configuration, we can add a JDBC request. We right-click on the thread group and then select the Add->Sampler->JDBC Request.

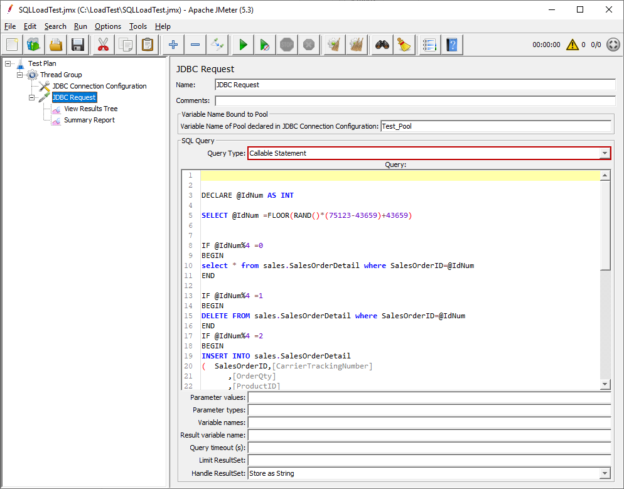
In the JDBC Request screen, we set the Variable Name of Pool declared in JDBC Connection Configuration parameter. This parameter value has to same as the JDBC connection pool name. We paste the following query into the query panel and save the test.
|
1 2 3 |
DECLARE @IdNum AS INT SELECT @IdNum =FLOOR(RAND()*(75123-43659)+43659) select * from sales.SalesOrderDetail where SalesOrderID=@IdNum |

Creating a Listener to Monitor the Test Results
Before starting our test sample, we need a Listener that helps to monitor and analyze the result of the test. For this load test, we will use two types of listeners. We right-click on the JDBC Request and select Add->Listener->View Results Tree to monitor the detailed result of the test.

At the same time, we add a Summary Report that helps to monitor a summarized result of the test. To add a summary report, we right-click on the JDBC Request and select Add->Listener->Summary Report to monitor the detailed result of the test.

Starting the JMeter Test
After creating all elements of the test project, we click the Start (green play) button which is located at the top of the screen.

- Tip: After the completion of the test, if we encounter an error as follows, we need to install Microsoft JDBC Driver

To fix this error, we need to follow the following steps:
-
Download the Microsoft JDBC Driver for SQL Server

- Unzip the driver files into any specific folder
-
Navigate to the test plan and then click to Browse… button
-
Select the jar file of the JDBC driver
-
The SQL JDBC driver will be added to the Library


When we click the View Result Tree, we can see the JDBC requests are completed successfully.

At the same time, we can see a summarized report on the Summary Report.

In this report, the fields explanations are like below:
Samples: This field represents the total number of the request that send to the server
Average: This value is the average time calculated during performing the requests and its unit is millisecond
Min: The shortest time that a single request performing and its unit is millisecond
Max: The longest time that a single request performing and its unit is millisecond
Error%: Percentage of failed requests
Throughput: The number of requests that can be handled by the server per time unit
A Real Load Test Scenario
The Adventurework marketing team is planning to make a campaign for Black Friday and they guess 80 or 100 users will create order concurrently. In terms of the database, it means that the SalesOrderDetail table will be under a heavy workload. The following query can generate simulate the possible user actions in the SalesOrderDetail when creating an order process. Now we will try to generate a workload test using this query and JMeter.
|
1 2 3 4 5 6 7 8 9 10 11 12 13 14 15 16 17 18 19 20 21 22 23 24 25 26 27 28 29 30 31 32 33 34 35 36 37 38 39 40 41 42 43 44 45 46 |
DECLARE @IdNum AS INT DECLARE @MaxNum AS INT SELECT @MaxNum=MAX(SalesOrderId) FROM sales.SalesOrderDetail WITH(NOLOCK) SELECT @IdNum =FLOOR(RAND()*(@MaxNum-43659)+43659) IF @IdNum%4 =0 BEGIN select * from sales.SalesOrderDetail where SalesOrderID=@IdNum END IF @IdNum%4 =1 BEGIN DELETE FROM sales.SalesOrderDetail where SalesOrderID=@IdNum END IF @IdNum%4 =2 BEGIN INSERT INTO sales.SalesOrderDetail ( SalesOrderID,[CarrierTrackingNumber] ,[OrderQty] ,[ProductID] ,[SpecialOfferID] ,[UnitPrice] ,[UnitPriceDiscount] ,[rowguid] ,[ModifiedDate]) SELECT ( SELECT MAX(SalesOrderID) FROM [Sales].[SalesOrderHeader]), [CarrierTrackingNumber] ,[OrderQty] ,[ProductID] ,[SpecialOfferID] ,[UnitPrice] ,[UnitPriceDiscount] ,NEWID() ,[ModifiedDate] FROM [Sales].[SalesOrderDetail] where SalesOrderID=@IdNum END IF @IdNum%4 =3 BEGIN UPDATE [Sales].[SalesOrderDetail] SET OrderQty=OrderQty*5 , UnitPrice =UnitPrice*5 where SalesOrderID=@IdNum END |
Firstly, we will set the number of users into the thread group and click the Infinite option. With these parameters, the number of users will reach 100 users in 100 seconds and will work until we stop.

Now we navigate to the JDBC request element and then paste the query that will create workload on the SalesOrderDetail table.

We will now start the load test and execute sp_WhoisActive to understand what is happening in the database during the test.

From the sp_WhoIsActive result set, we can see that many sessions are pending in suspended status with their wait types as PAGELATCH_EX. This condition, explains we can face an exclusive latch contention problem on Black Friday and with long response times.
Conclusion
The database load test is very beneficial to identify the performance and other problems before releasing databases to production. Together with the JMeter, we can use the following tools to identify issues:
- Wait statistics
- sp_WhoIsActive
- Performance Monitor
- Database performance monitoring tools
- Query Store

Most of his career has been focused on SQL Server Database Administration and Development. His current interests are in database administration and Business Intelligence. You can find him on LinkedIn.
View all posts by Esat Erkec
- SQL Performance Tuning tips for newbies - April 15, 2024
- SQL Unit Testing reference guide for beginners - August 11, 2023
- SQL Cheat Sheet for Newbies - February 21, 2023