Learn to identify and point out potential issues – no programming experience necessary.
Analyzing a Waterfall Chart mostly boils down to recognizing common patterns, and understanding what you can safely ignore.
In a continuation of our first Waterfall Charts explained article, we’ll now go through general concepts to help you analyze a Waterfall Chart and discover performance issues for yourself.
Overview
This article is meant to be a very broad and general approach to analyzing Waterfall Charts.
It’s difficult to truly know what’s going on in a Waterfall Chart without a lot of experience and technical knowledge. Even still, you may often be left guessing, as the nature of websites is complex in design and implementation.
Through these guidelines, our goal is to help you recognize common issues or patterns that – if present in your Waterfall Chart, can give you some insights on how to diagnose and remedy your performance issues.
Key Things to Know
There are a few things to keep in mind when looking at a Waterfall Chart.
1) Waterfall Charts are Scaled
Scaled Waterfall Charts may be misleading at first glance.
This is a critical point to note about Waterfall Charts. Length of bars and gaps are scaled to the total page load time and number of requests.
Example A – Fully loaded time 20 seconds with 11 requests
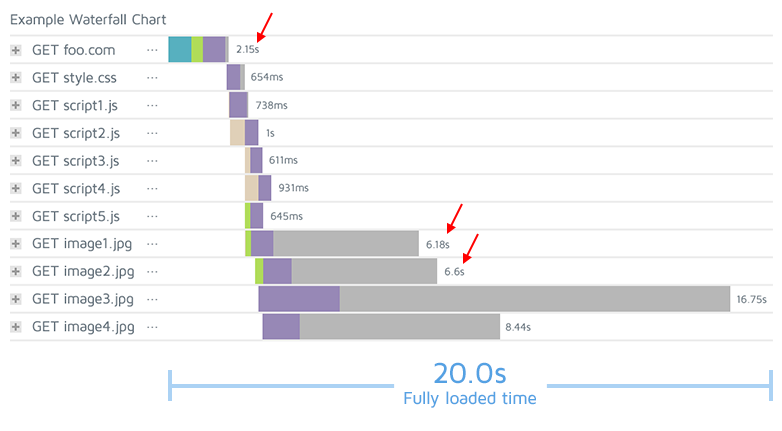
This particular Waterfall Chart has long load times mostly due to images. Notice that the request duration times are in seconds (s).
Example B – Fully loaded time 0.36 seconds with 11 requests
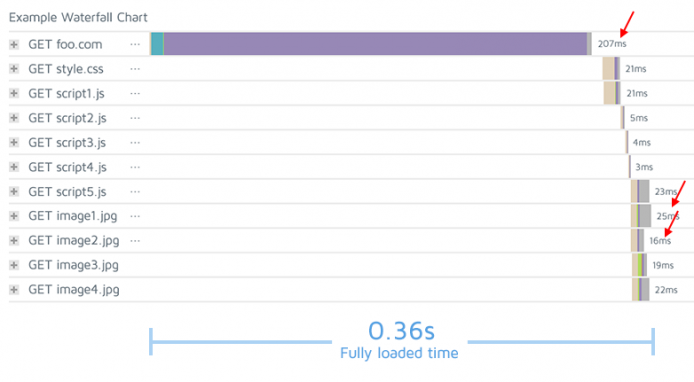
These request duration times are in milliseconds (ms).
At first glance, the above Waterfall Chart might have you believe that an issue exists with back-end, as the initial bar appears to be very long. However, upon closer inspection, you’ll see there really isn’t any issue at all, as 207ms for the Backend time is generally fine.
Key Takeaway
A short fully loaded time scales the length of the bars overall, and bars appear long. Always look at the fully loaded time and actual request duration time, to ensure you’re reading the chart in the right context.
2) Response Headers are Revealing
While technically not a part of analyzing a Waterfall Chart pattern – understanding what your requests are responding with is incredibly useful.
This could include data like:
- CDN details
- Cache status
- Expiry values
- Compression settings
- …and more
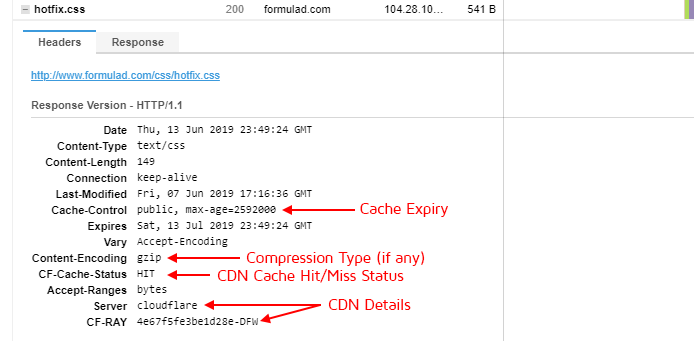
Our library looks at response headers for many of the audits. If relevant data is missing in the response header, it’s likely your GTmetrix score will consequently be reduced.
Key Takeaway
If GTmetrix is reporting issues – check your response headers first. They usually help you confirm/refute issues, or provide insights to point you in the right direction to track down a specific performance issue.
How to Quickly Draw Conclusions
Now that you’re familiar with a Waterfall Chart’s lines, colors and bars, let’s look at how we can make quick assessments.
Keep in mind – just because you identify some of these patterns in your Waterfall Chart, it doesn’t necessarily mean they need attention or fixing; they don’t always indicate the presence of an error.
That being said, here are some patterns that you should look out for.
4xx/5xx Requests
A red request indicates an error occurred while attempting to load the request. If unable to retrieve the request, the browser will likely skip it.
At times, these requests can cause blocking, or continue attempting to complete the request, making your entire load performance suffer.
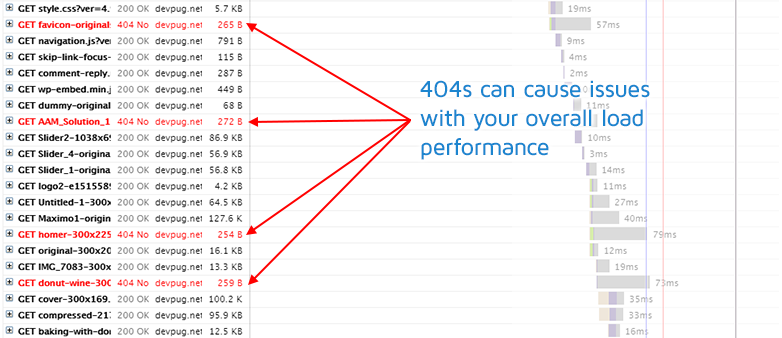
Remove or fix any requests that cause these errors so you have a clean, error-free Waterfall Chart to assess.
Long Bars
Long bars really indicate long request duration times. Anything over 500ms should be investigated (with video files being generally OK).
Potential causes behind long bars:
Receiving
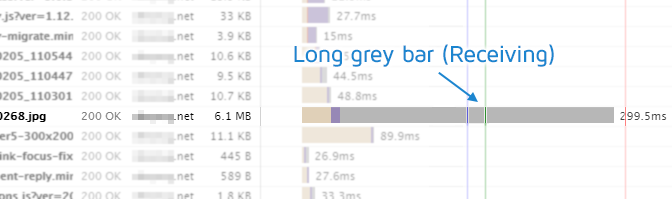
This is the most common cause of a long bar. Large file sizes result in longer times to download data naturally, and so excessively large files reveal themselves with long grey bars.
For images, GTmetrix will warn you of unoptimized images via the Efficiently encode images audit.
Waiting
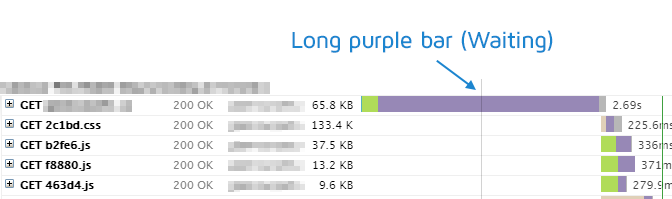
If you see a long purple bar, this may indicate server-side issues. This is essentially the time it takes for the server to generate a response for the request.
If the first initial response is long, it may indicate a back-end issue. Read our article here on Why is my page slow?
Blocking
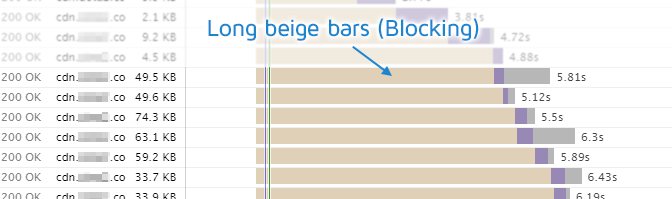
Long beige bars indicate the request was initiated, but being blocked or queued. A connection cannot be established for the resource as something (JavaScript/CSS execution or maxed simultaneous connections) is preventing the connection to the server.
Connecting
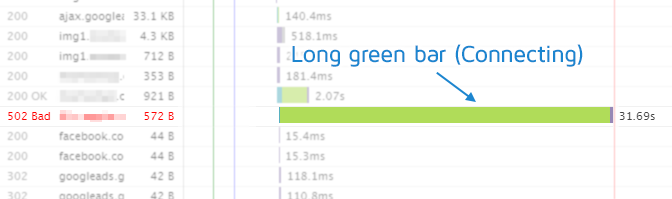
Finally, extended green bars indicate the time it takes to connect to the server for the request. This could indicate network issues, connection errors, or an overloaded server.
Again, bear in mind that long bars are relative to the overall fully loaded time – read more here.
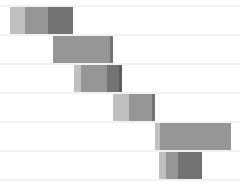
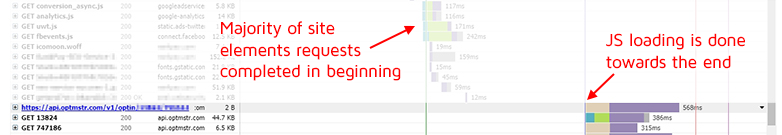
Long Empty Gaps
Empty gaps between requests indicate the execution or parsing of scripts somewhere that prevent proceeding resources from being pulled (i.e. No requests occurred during this time – Source)
The earlier up in the Waterfall Chart a gap appears, the more effect it has on performance as it is delaying the rest of the page resources from loading (i.e. more of an incomplete page is displayed). If a long gap appears early in your Waterfall Chart, prioritize investigation of its cause.
Empty gaps towards the end of the Waterfall Chart are generally OK, as the scripts execute when the majority of the resources have already been requested and processed.
Overall, this pattern is unfortunately difficult to determine the issue of. Websites are complex with any number of JavaScript/CSS files or even inline scripts running and defining a page’s load behaviour. A key takeaway is to know that a script is running/executing somewhere that prevents other requests from proceeding. A developer can further investigate the cause of these gaps.
Eliminate render-blocking resources (Previously: Defer Parsing of JavaScript)
One potential audit to note for these gaps is the Eliminate render-blocking resources audit; it encourages you to reduce the impact of render-blocking resources (scripts, stylesheets, etc.) by deferring or asynchronously loading non-critical resources, removing unused resources, and in general, optimizing the Critical Rendering Path.
In essence, you can reduce the amount of time it takes for the page to load for a user, by delaying the loading of “under-the-hood” resources like analytics JavaScript, a Facebook pixel, or even marketing tools like Hotjar, LiveChat or OptinMonster.
There are other possibilities as to why these gaps could occur though, so notify a developer of your assessments and have them take a deeper dive.
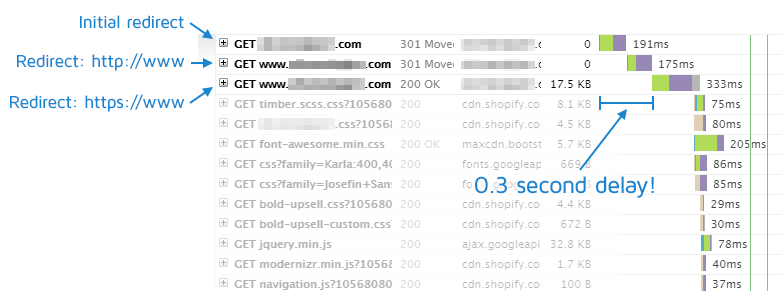
Slow Redirect Chains
If you see multiple 3XX codes in the beginning of your Waterfall Chart, this indicates redirects that unnecessarily delay the process of loading your page.
Sometimes redirects are necessary; however, be sure to optimize your redirects for minimal delays.
Reasons for multiple redirect chains include
- Redirect to www or non-www
- http:// to https://
- Redirect to alternative directory
- Combinations of the above
A common redirect chain issue is when this happens:
- A user types in example.com in their browser
- Gets redirected to http://www.example.com
- Then again, gets redirected to https://www.example.com
Redirects should go from non-www and http://, directly to the final www and https://.
Long Waterfall Chart Overall
If you’re experiencing poor performance yet see no outstanding patterns, check the length of your Waterfall Chart.
If it’s a long Waterfall Chart, you likely have a large amount of requests on your page, causing performance issues.
Large amounts of requests are problematic because, the more items you request from the server the longer it takes to download, process and render them.
Requests can be numerous due to:
Third-party services
Adding third-party services is a quick way to bloat your requests. Popular widgets include Social media embeds, YouTube video embeds, marketing trackers like Hotjar, or services like LiveChat.
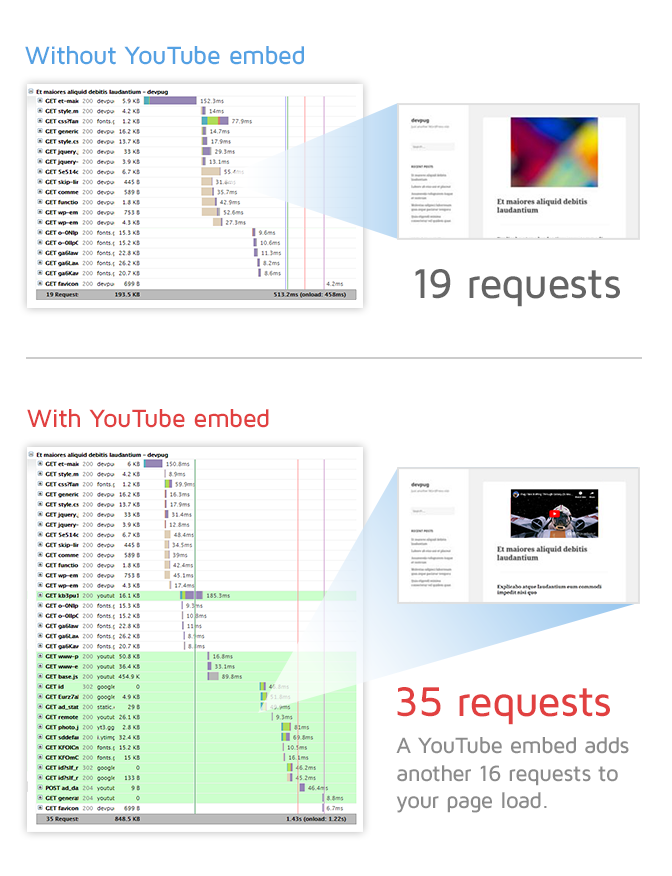
Review your site and ensure that the third-party services you’ve implemented provide real value to you. If not, consider removing them from your site all together.
Displaying too much content (images, products, articles, etc.)
As we mentioned in a previous article, offering too much on your page negatively impacts performance.
You may have the best intentions in mind by providing lots of content for your visitor to see, but don’t expect people to read and look at everything.
Summary
Waterfall Charts offer a window to assess page load behaviour, as they provide a request-by-request view of your actual page load.
Web performance is made up of an intricate relationship of front-end/back-end code, server configuration, hardware, and network conditions. In other words, it’s complicated.
Waterfall Charts offer a window to assess page load behaviour, as they provide a request-by-request view of your actual page load.
However, they’re not completely transparent – it takes a bit of experience, technical knowledge and even experimentation to truly understand all that is going on (and even then it’s still a little cloudy sometimes).
Hopefully this article gives you you a little more understanding of how to assess Waterfall Charts, so you can better direct your optimization efforts.
Need help? Hire a Developer
We only recommend products and services that we’ve reviewed and tested ourselves. Below you’ll find affiliate links to our optimization partners – If you decide to purchase their services through the links provided, we may be paid a commission at no extra cost to you.
Still not sure what’s going on with your Waterfall Chart?
We recommend finding help using one of our optimization partners. They’re a great option for website owners that want to improve performance, but don’t have the technical skill to implement optimizations.
Have a look at our partners below:
Got a WordPress site?

Check out WP Speed Guru – a WordPress optimization specialist who can help you improve performance of premium themes, WooCommerce implementations and all things WordPress.
Optimize your WordPress performance today
Got a Shopify site?
![]()
Our friends at Storetasker provide consultation services for Shopify platforms. Find an expert to help you with your site needs; whatever they are.
Find an expert to help with your site today
Got any other type of site?
![]()
Visit Fiverr, register for an account, and search for a speed optimization service that matches your platform, whether it’s WordPress, Magento, Shopify, Squarespace, Opencart, etc.
Find an expert to help with your site today