
In this article, we will learn what is plan regression and how we can fix this issue with help of the Automatic Plan Correction feature.
Introduction
Sometimes, query tuning operations can get very challenging and complicated in SQL Server. With the SQL Server 2016, a new feature Query Store has been introduced and this feature captures and retains the executed queries execution plan and runtime statistics. In this way, we started to identify query performance issues more easily. In the next step, we have met a new feature in SQL Server 2017 and this feature’s name is Automatic Plan Correction. This feature identifies the query plan issues automatically and suggests some recommendations to fix these issues. It can also apply the suggested query tuning recommendations automatically.
Pre-Requirments
As we stated, we need to enable the Query Store feature to activate the Automatic Plan Correction. The following query will enable the Query Store for any particular database.
|
1 2 3 4 5 6 7 8 9 |
ALTER DATABASE DatabaseName SET QUERY_STORE = ON ( OPERATION_MODE = READ_WRITE , CLEANUP_POLICY = ( STALE_QUERY_THRESHOLD_DAYS = 5 ) , DATA_FLUSH_INTERVAL_SECONDS = 900 , MAX_STORAGE_SIZE_MB = 10 , INTERVAL_LENGTH_MINUTES = 1 ); |
Firstly, we don’t enable the automatic plan correction feature for this reason, we will disable it through the following query.
|
1 2 |
ALTER DATABASE DatabaseName SET AUTOMATIC_TUNING ( FORCE_LAST_GOOD_PLAN = OFF ); |
What is query plan regression in SQL Server?
SQL Server query optimizer’s goal is to generate optimum execution plans for the queries. Statistics, indexes, cardinality estimator, and some other factors have an impact upon the generated execution plans. SQL Server stores the generated execution plans in the plan cache and reuses the cached plans for the next execution of the same queries. In this way, the query optimizer prevents the consumption of redundant time and CPU in order to generate a new execution plan when the same query is executed. However, for some reason (creating or dropping indexes, updating the statistics, etc.), SQL Server may give up using the cached query plan and compile a new query plan. The newly created query plan shows underperforms from the previous one as a result it influences the query performance negatively. The main symptom of this problem is that your query suddenly slows down in the database, although there is no remarkable change. This situation is called the query plan choice regression.
How does a query plan regression happen?
As we mentioned in the previous section, SQL Server stores the query plans in the cache so that, when the same query is executed for the different parameters it will use the same query plan. However, for some queries, the optimum plan can differ depends on the used parameters. Let’s illustrates this circumstance with an example.
Firstly, we will create a sample table like the one below.
|
1 2 3 4 5 6 |
CREATE TABLE TestPlanRegresion ( Val int, definition_ nvarchar(200), INDEX IX_001_ColumnStore nonclustered columnstore (Val), INDEX IX_002_NCluster(Val) ); |
This table includes two types of indexes, the first one is non-clustered columnstore index that is stored data in a column-wise fashion and the other one is the classical B-Tree type index. As a second step, we will populate the table with some non-homogeneous data.
|
1 2 3 4 5 6 |
INSERT INTO TestPlanRegresion(Val, definition_) VALUES (1, 'First Row') GO INSERT INTO TestPlanRegresion(Val, definition_) SELECT TOP 1000000 2 AS Val, o.name from sys.objects, sys.all_columns o |
After populating the data, we will update the indexes.
|
1 2 3 4 5 6 |
ALTER INDEX IX_002_NCluster ON dbo.TestPlanRegresion REBUILD GO ALTER INDEX IX_001_ColumnStore ON dbo.TestPlanRegresion REORGANIZE WITH (COMPRESS_ALL_ROW_GROUPS = ON) GO CHECKPOINT |
Now we enable the actual execution plan and run the query.
|
1 2 |
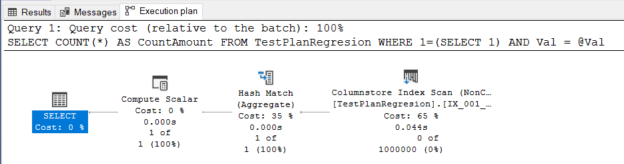
EXECUTE sp_executesql @stmt = N'SELECT COUNT(*) FROM TestPlanRegresion WHERE Val = @Val', @params = N'@Val int', @Val = 2 |

In this query plan, SQL Server query optimizer has decided to use columnstore index to access the one million rows and it is very logical for query tuning. Then the row counting operation is performed by the hash match aggregate operator. We come across the hash match aggregate when the storage engine is dealing with the unsorted huge amount of data. The compute scalar operator converts the result of the stream aggregate operator to an integer because the COUNT function returns the data type as an integer. Understanding the execution plan properly is very important for query tuning.

Now, we will execute the same query 500 times so that the query store can capture the required data.
|
1 2 3 4 5 6 |
DECLARE @Counter AS INT=1 WHILE @Counter <=500 BEGIN EXECUTE sp_executesql @stmt = N'SELECT COUNT(*) FROM TestPlanRegresion WHERE Val = @Val', @params = N'@Val int', @Val = 2 SET @Counter = @Counter+1 END |
Now, we will remove the previous query’s plan from the plan cache. To remove a specific execution plan from the plan cache, it is first necessary to identify the underlining query plan. To find out the query plan, we can use the following query.
|
1 2 3 4 5 6 7 8 |
SELECT cp.plan_handle, cp.objtype, cp.usecounts, DB_NAME(st.dbid) AS [DatabaseName], st.text FROM sys.dm_exec_cached_plans AS cp CROSS APPLY sys.dm_exec_sql_text(plan_handle) AS st WHERE st.text LIKE '%SELECT COUNT(*) FROM TestPlanRegresion WHERE Val = @Val%'; |

We will remove the cached query plan.
|
1 |
DBCC FREEPROCCACHE (0x06000D00CC71E53710F8CBC54001000001000000000000000000000000000000000000000000000000000000); |
Let’s execute the same query with a different parameter and analyze the execution plan.
|
1 |
EXECUTE sp_executesql @stmt = N'SELECT COUNT(*) FROM TestPlanRegresion WHERE Val = @Val', @params = N'@Val int', @Val = 1 |

As we can see in the actual execution plan of this query, it has used an index seek operator and it has performed a seek predicate. The reason is that Val columns data stored in a non-clustered index structure because of the IX_002_NCluster index definition so the SQL Server storage engine can access the filtered data directly via using the B-tree index structure. The stream aggregate operator performs aggregation functions ( SUM, COUNT, AGV, MIN, and MAX) in the queries for this query it has accomplished the counting operation.
When we execute the query with the first parameter, the query optimizer decides to use a different and inefficient execution plan for this query.
|
1 |
EXECUTE sp_executesql @stmt = N'SELECT COUNT(*) FROM TestPlanRegresion WHERE Val = @Val', @params = N'@Val int', @Val = 2 |

The select operator details can give some details about this situation. In the parameter list attribute of the select operator, we can find out some interesting details. The executed query is compiled for the different parameters and the query optimizer has chosen this query plan.

This issue is called plan choice regression or plan regression.
SQL Server Automatic Plan Correction Recommendations
The Automatic Plan Correction feature tracks the query plan regression issues that occur in the database. When it detects a regressed query, it automatically forces the query to use the efficient plan instead of using the worse one. Now we make a demonstration of this feature.
-
We activate the Automatic Plan Correction feature and clear the Query Store data
12ALTER DATABASE DatabaseName SET AUTOMATIC_TUNING ( FORCE_LAST_GOOD_PLAN = ON );ALTER DATABASE DatabaseName SET QUERY_STORE CLEAR; -
We clear all query plan cache that is compiled and stored by the query optimizer. This command can hurt your database performance, for this reason, don’t use it in the production databases
1DBCC FREEPROCCACHETip: While writing this article, I experienced a problem with my query plan cache. SQL Server resets the query plan cache for a short time without any logical reason. In general, this problem is related to the Enable Lock Pages in Memory (LPIM) property. In SQL Server 2019, we can find out this property in the SQL Server Configuration Manager. Under the advanced tab of the SQL Server 2019, we can enable Lock Pages in Memory property as shown below:

-
We execute the following query 500 times so that the Query Store can capture the statistics of a query
123456DECLARE @Counter AS INT=1WHILE @Counter <=500BEGINEXECUTE sp_executesql @stmt = N'SELECT COUNT(*) FROM TestPlanRegresion WHERE Val = @Val', @params = N'@Val int', @Val = 2SET @Counter =@Counter+1END -
We clear the plan cache and execute the same query with a different parameter and then we execute it with the same parameter 500 times. So, the query starts to use a sub-optimal query plan
123456789DBCC FREEPROCCACHEGOEXECUTE sp_executesql @stmt = N'SELECT COUNT(*) FROM TestPlanRegresion WHERE Val = @Val', @params = N'@Val int', @Val = 1DECLARE @Counter AS INT=1WHILE @Counter <=500BEGINEXECUTE sp_executesql @stmt = N'SELECT COUNT(*) FROM TestPlanRegresion WHERE Val = @Val', @params = N'@Val int', @Val = 2SET @Counter =@Counter+1END

The sys.dm_db_tuning_recommendations dynamic management view returns the identified query tuning issues and the status of these recommendations.
|
1 2 3 4 5 6 7 8 9 10 11 12 13 14 15 16 17 18 19 |
SELECT reason, score, JSON_VALUE(state, '$.currentValue') state, JSON_VALUE(state, '$.reason') state_transition_reason, script = JSON_VALUE(details, '$.implementationDetails.script'), [current plan_id], [recommended plan_id], is_revertable_action,type FROM sys.dm_db_tuning_recommendations CROSS APPLY OPENJSON (Details, '$.planForceDetails') WITH ( [query_id] int '$.queryId', [current plan_id] int '$.regressedPlanId', [recommended plan_id] int '$.recommendedPlanId', regressedPlanExecutionCount int, regressedPlanCpuTimeAverage float, recommendedPlanExecutionCount int, recommendedPlanCpuTimeAverage float ) as planForceDetails; |

For our demonstration, SQL Server has been forced to use a query plan that includes a columnstore index and the data engine has started to use it instead of the sub-optimal plan. In the reason column, why this query tuning issue is applied for this query. The Verifying status identifies that this recommendation has been applied automatically by the automatic plan correction feature and it still waits for the verification process to compare the performance of the forced plan with the regressed plan. This situation can report using the Queries With Forced Plans.

Conclusion
In this article, we have discovered the Automatic Plan Correction feature and we have learned how it can help us in the query tuning operations. This feature can be very useful to overcome plan regression issues and may help to resolve parameter sniffing problems. On the other hand, we can disable this feature and apply the tuning recommendations manually.

Most of his career has been focused on SQL Server Database Administration and Development. His current interests are in database administration and Business Intelligence. You can find him on LinkedIn.
View all posts by Esat Erkec
- SQL Performance Tuning tips for newbies - April 15, 2024
- SQL Unit Testing reference guide for beginners - August 11, 2023
- SQL Cheat Sheet for Newbies - February 21, 2023