New LUX JavaScript Dashboards

As organizations work to improve performance for users around the world on slower networks and devices, the focus on JavaScript continues to grow. LUX's new JavaScript dashboards help to identify the problems and solutions for creating a fast, joyous user experience.
LUX is SpeedCurve's real user monitoring product. We launched it two years ago with four dashboards: Live, Users, Performance, and Design. Today we've added two more LUX dashboards: JavaScript and JS Errors. These new dashboards let you see the impact JavaScript has on your site and on your users with new metrics, including First CPU Idle and First Input Delay, and new features, such as correlation charts that show you how CPU time correlates with bounce rate.
LUX JavaScript Dashboard
Ten years ago, the network was the primary bottleneck slowing down web pages. Today it's the browser CPU, especially on mobile devices, and JavaScript consumes more CPU than all other browser activities combined. That's why LUX focuses on the impact JavaScript has on the CPU and on your users.
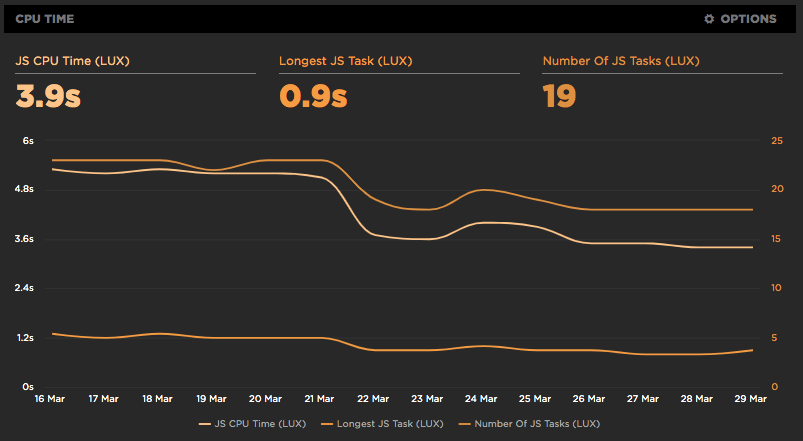
LUX measures CPU using the Long Tasks API. A "long task" is defined as a browser event that takes more than 50ms to execute. LUX shows the total of all long tasks, the longest long task, and number of long tasks in the page. In this example, an improvement made on March 22nd shaved off more than one second of CPU time:
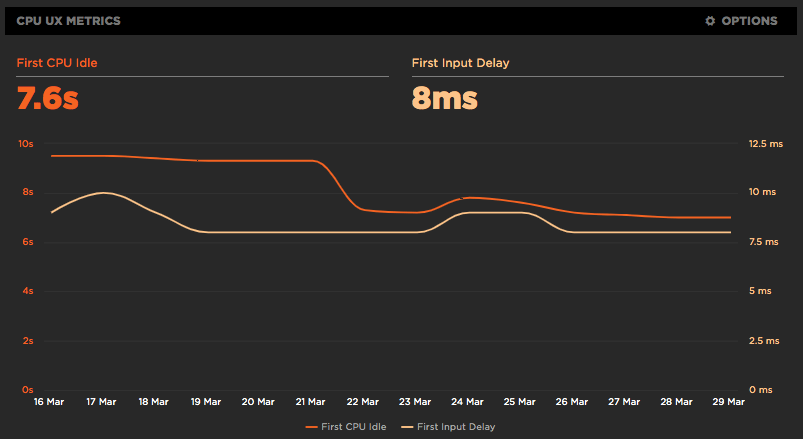
Long tasks make pages feel janky. Two metrics that capture jankiness are shown in the LUX chart below:
- First Input Delay (FID) measures the gap between when a user interacts with the page (e.g, clicks or scrolls) and when the browser is able to act on that interaction.
- First CPU Idle measures how long it takes before the page is no longer janky.
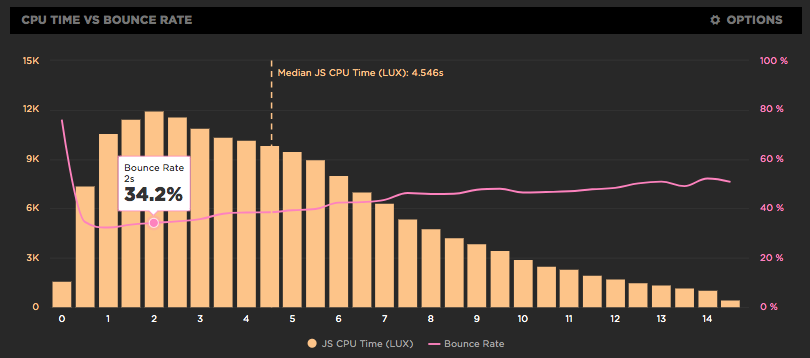
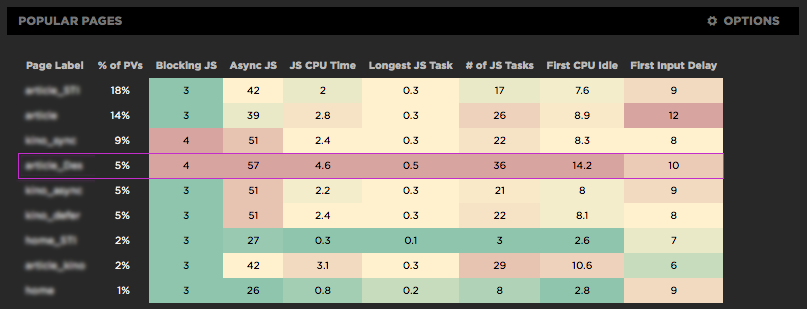
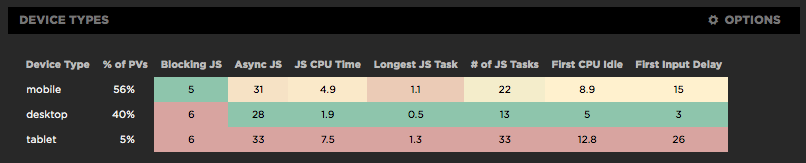
The LUX JavaScript dashboard uses heatmaps to help teams identify what they should work on next. The heatmap below shows how well different page types are performing against a set of JavaScript metrics. Green is good, yellow is okay, and red is poor. The first three page types have mixed results, but the fourth page is doing poorly across the board. Since it accounts for a large amount of traffic (5%), focusing on this page has the greatest chance for improvements that impact a large number of users.
In addition to showing heatmaps for page types, the LUX JavaScript dashboard also shows them for device types and browsers. The device type heatmap below indicates that tablets need the most attention.
LUX JS Errors Dashboard
With the increased focus on and activity around improving JavaScript, it's important to track errors to make sure JavaScript enhancements don't break functionality. The LUX JS Errors dashboards helps you monitor and isolate errors.
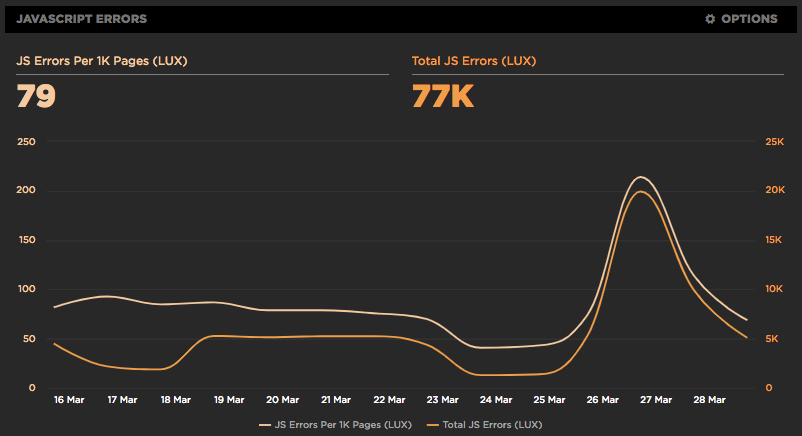
In addition to showing the total number of errors, the chart below shows the error rate. This is helpful if your traffic has regular peaks and valleys (e.g., weekends) where the number of errors might fluctuate but error rate should remain fairly flat. In the example, a JavaScript error on March 27th caused both metrics to spike!
The list of Top Errors helps you identify the errors that are most affecting customers. The LUX Errors dashboard also shows the distribution of errors across top browsers, regions, and pages. You can click on any error message to drill down on it.
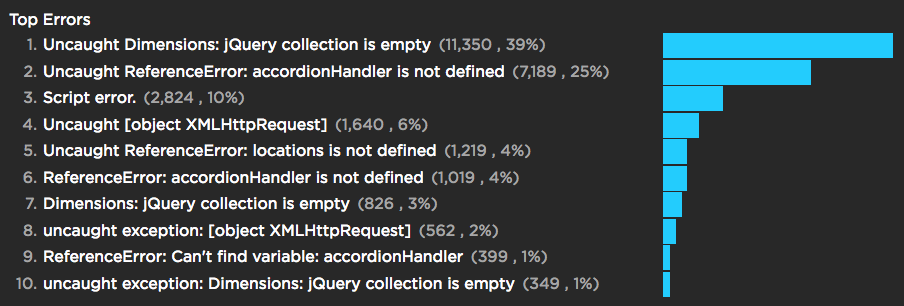
Note that "Script error" is typically from cross origin scripts where error details are not available. This can happen for third party scripts but also for scripts you own that are served from a different domain, such as a CDN. To see the error details you must include the crossorigin SCRIPT attribute and the Access-Control-Allow-Origin response header.
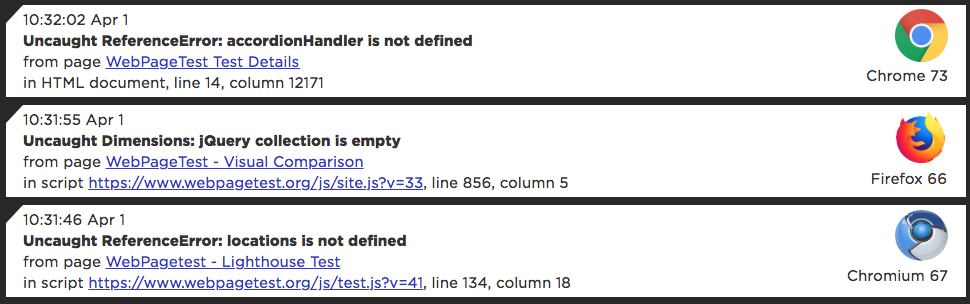
The details for individual errors makes it easy to find and fix problems. The name of the offending script is given, or "HTML document" if the error occurred in an inline script. The line and column number help track down exactly where the error occurs.
Get started
If you're already a LUX user, these JS dashboards are available in your LUX menu. If you're not using LUX, give it a try for free.
Read Next

See how customers are using SpeedCurve to make their sites faster.

See industry-leading sites ranked on how fast their pages load from a user's perspective.