
At Dynatrace’s 2020 Perform Conference, we shared approaches for how our customers are using Dynatrace to help them “Release Better Software Faster”. One highlight from the conference was the introduction of the open-source project called Keptn which Dynatrace is leading.
Keptn is an event-based platform for continuous delivery and automated operations to help developers focus on code instead of witting tons of configuration and pipeline files. It helps organizations deliver cloud-native applications by reducing the maintenance of complex pipelines.
Keptn can choreograph the entire set of actions for Continuous Delivery and automated problem remediation, as well as integrating with existing Continuous Delivery and Integration tooling including Jenkins. The Jenkins to Keptn integration was explained and demoed in one of our Performance Clinic videos; “.
However, we know that not everyone is ready just yet for full-scale Keptn. So, in this blog, I’ll share how to create and use Jenkins shared libraries to provide an easy way to integrate Jenkins pipelines, to Dynatrace using Dynatrace’s Application Programming Interface (API).
But first, let me explain a little about Jenkins code libraries and the Dynatrace API.
Jenkins code libraries
Jenkins support shared libraries that can be defined within external source control repositories, such as GitHub, and loaded when the pipeline jobs run. Library code is developed using the Groovy programming language which is aimed at improving developer productivity thanks to a concise, familiar, and easy to learn syntax.
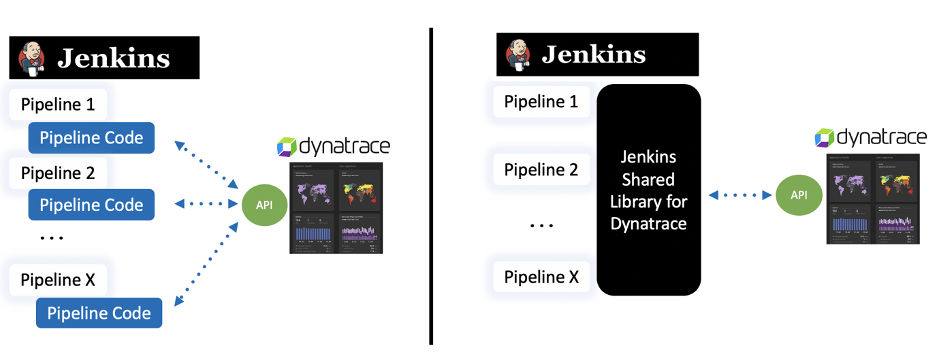
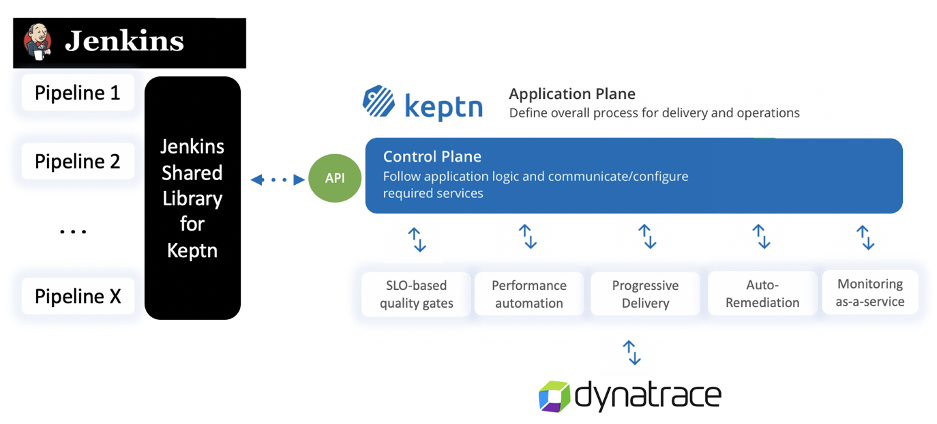
Referring to the pictures below, the left side shows pipelines without a shared library where each pipeline duplicates the logic to call the Dynatrace API. On the right, is a depiction of a shared library, with re-usable logic to call Dynatrace API, referenced from multiple pipelines.
Dynatrace API
The Dynatrace API is used to automate your monitoring tasks, export different types of data into your third-party reporting and analysis tools, and to integrate into workflow tools such as Jenkins. API communication ensures safety by using secured communication via the HTTPS protocol.
Broadly, the Dynatrace API is broken into two categories: Environment and Configuration. Each category has a collection of interfaces that retrieve, add, update, and delete data within Dynatrace.
- The Configuration API helps you track and manage your Dynatrace monitoring environment configurations by providing endpoints to query, add, update, and delete Dynatrace configuration. Configuration interfaces include Alerting profiles, Dashboards, Cloud provider credentials, and Anomaly Detection rules.
- The Environment API helps you further automate your toolchain workflows such as your deployment pipeline, CI toolchain, or a simple monthly architecture-topology report. Environment interfaces include queries for topology, metrics, problems, and user sessions to name a few. These interfaces also allow toolchains to push problem comments, events, and metrics into Dynatrace for monitored entities.
Here are just a few use cases made possible from these APIs within a pipeline:
- Add context for what and who is performing deployments, configuration changes, or testing activity for your environment through information from Dynatrace events
- Create a synthetic monitor that matches the deployed application
- Configure a maintenance window for a deployment
- Create a Dynatrace dashboard for the deployed service
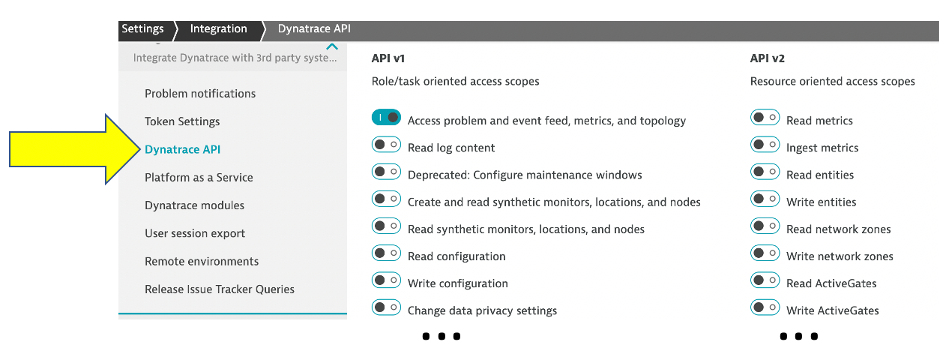
A Dynatrace API token must be passed as part of the request header to authorize the Dynatrace API request. This token is fine-grained, meaning you also need specific permission(s) such as read/write configuration when generating the token. An API token can be created in the Dynatrace web UI or from the API. Below is a screenshot from the Dynatrace API token configuration page.
Let’s review an example
I’m going to use the Dynatrace Event API as an example because it’s the easiest way to get started and adds tremendous value with just one API call.
Dynatrace information events provide context about what’s happening to an application by providing additional details for Dynatrace for deployments, configuration changes, or testing activity. This information speeds up triage by adding context to what is happening with the application by DevOps Teams.
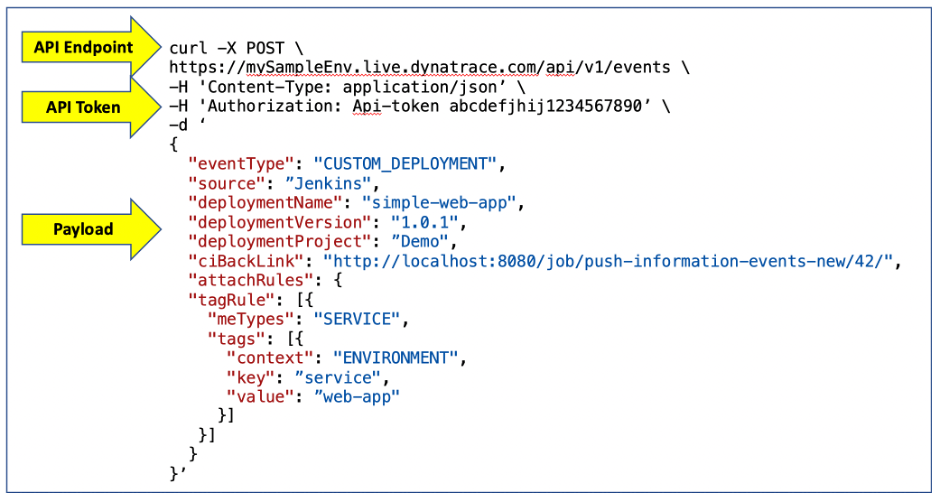
The Dynatrace event API call is a single web request. The Dynatrace environment has an API endpoint and the API Token is passed in along with the payload of the HTTP POST request. The example below shows the request for the CUSTOM_DEPLOYMENT event for the event shown above, using the Unix curl utility.
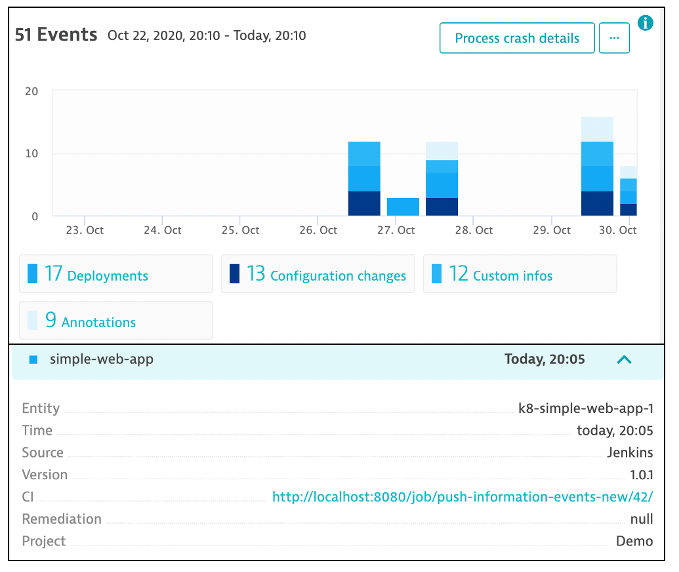
Information events are viewable on the host, process, and services within Dynatrace. Below is an example of a deployment event that was created from that API call with all the detail for the source, version, and pipeline job that performed the deployment.
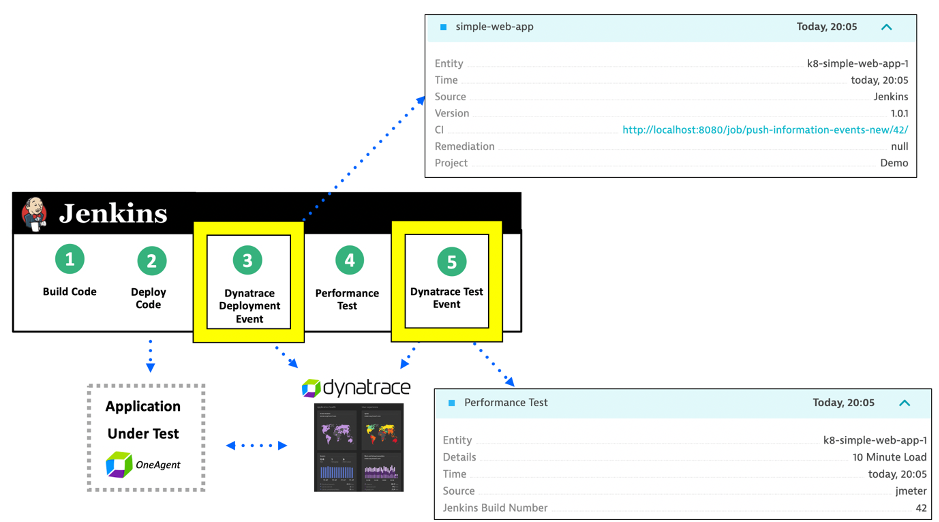
Information events can be added to existing Jenkins pipelines to the steps where code is deployed, and performance tested. The diagram below demonstrates this:
- Committed code is checked and built as some deployable artifact
- Artifact is deployed into some environment
- Dynatrace Deployment event is sent to Dynatrace to indicate artifact version and pipeline job details
- Performance test is run
- Dynatrace Information event is sent to Dynatrace to indicate the performance test details such as start/stop time and test result status
Another bonus of these information events is that they can be incorporated into a root cause problem determined Dynatrace’s AI engine, Davis®. Below is an example Dynatrace problem card with both custom info events (#1) and deployment events (#2) for a service.
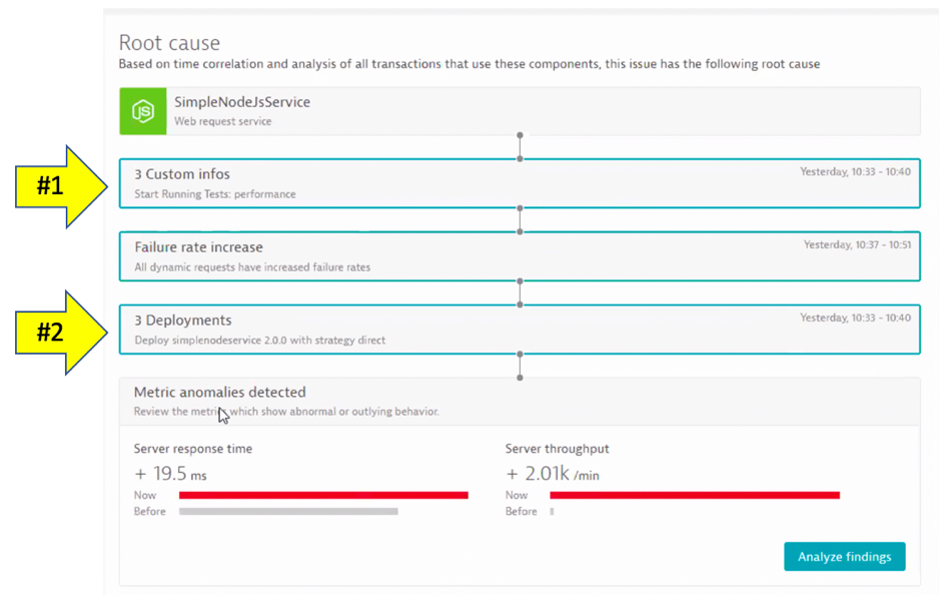
Now when you get alerted about an issue, you immediately see that a load test or deployment took place – AND – in one click you can review the system, job, and team responsible!
Jenkins setup
The Dynatrace Jenkins library for this example is available in this GitHub repo. Within the library, functions were created for each Dynatrace event type:
- pushDynatraceDeploymentEvent
- pushDynatraceConfiguration
- pushDynatraceInfoEvent
- pushDynatraceAnnotationEvent
Each function accepts parameters for the Dynatrace API URL, Dynatrace API token, and required event properties such as description, source, and type that the API expects.
This repo has detailed setup instructions and usage examples, but I will cover a few highlights of this process.
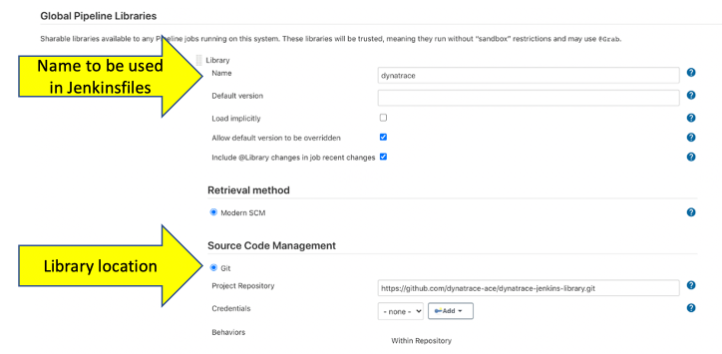
#1 Configure Jenkins with the Dynatrace shared library
Once the Library code is built and saved in a source code management repository like GitHub, the repository URL is added to the Jenkins Global Pipeline Libraries settings. Below is a screenshot for configuring the Dynatrace library from a GitHub as the source code management repository.
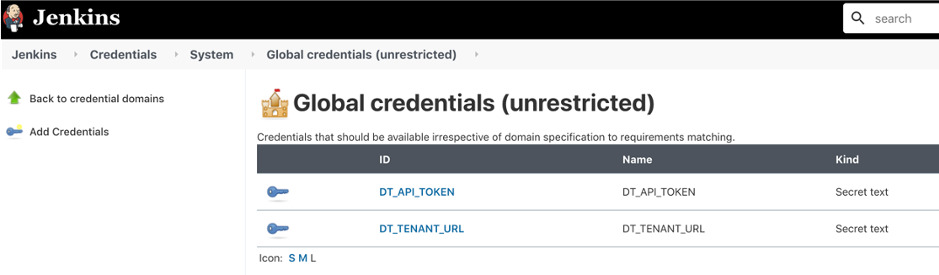
#2 Configure Jenkins with the Dynatrace API token and URL
Values such as tokens, passwords, and URLs are best maintained outside the pipeline scripts as both a security best practice and to allow centralized management of these secrets.
One way to maintain these secrets is to set them as Jenkins environment variables in the Global properties section of Jenkins. But, a more secure way is to use Jenkins Global credentials since the Jenkins will mask the value for the secrets within Jenkins pipeline execution logs.
The screenshot below shows the Dynatrace API URL and API Token configured as two Global Credentials within Jenkins.
#3 Create pipeline script
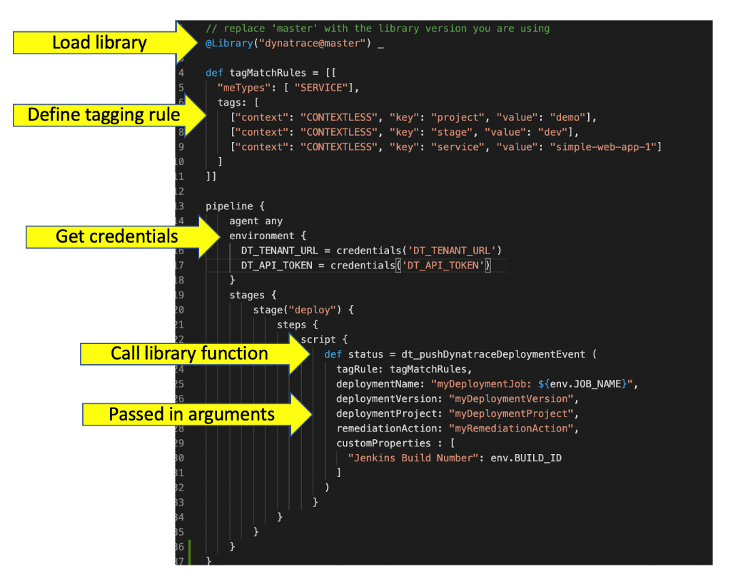
To use a Jenkins library, a directive such as @Library(‘myLibrary’) is added to the top of a pipeline script to load the library. The script, known as a Jenkinsfile, calls the function in the library with any required parameters.
Below is an example of a Jenkinsfile script that loads a Dynatrace library, gets the API credentials as variables, and then calls a shared library function with required parameters for creating a Dynatrace Deployment event.
Jenkins shared library for Keptn
When you’re ready to try out Keptn, see this shared Jenkins library that can be used to integrate Jenkins to Keptn. The diagram below shows how this shared library provides an additional layer of automation of higher-level use cases.
Try it yourself
All the code referenced in this blog is open-source so that you can re-use and contribute back your improvements.
What I have shown are just some examples of what’s possible with the Dynatrace API. Be sure to check out our other blogs, videos, and presentations on the subject of DevOps for more use cases for delivering software faster and with higher quality.


Looking for answers?
Start a new discussion or ask for help in our Q&A forum.
Go to forum