Mon.May 01, 2023

article thumbnail

Prometheus AWS Exporter and Grafana

DZone

The main purpose of this article and use case is to scrape AWS CloudWatch metrics into the Prometheus time series and to visualize the metrics data in Grafana. Prometheus and Grafana are the most powerful, robust open-source tools for monitoring, collecting, visualizing, and performance metrics of the deployed applications in production. These tools give greater visibility other than collecting the metrics also, where we can set up critical alerts, live views, and custom dashboards.

AWS 256
article thumbnail

What is IT operations analytics? Extract more data insights from more sources

Dynatrace

With 99% of organizations using multicloud environments , effectively monitoring cloud operations with AI-driven analytics and automation is critical. IT operations analytics (ITOA) with artificial intelligence (AI) capabilities supports faster cloud deployment of digital products and services and trusted business insights. Therefore, it is a necessary component of any enterprise’s cloud journey now and in the foreseeable future.

Analytics 190
Insiders

Sign Up for our Newsletter

This site is protected by reCAPTCHA and the Google Privacy Policy and Terms of Service apply.

Trending Sources

article thumbnail

How to Optimize CPU Performance Through Isolation and System Tuning

DZone

CPU isolation and efficient system management are critical for any application which requires low-latency and high-performance computing. These measures are especially important for high-frequency trading systems, where split-second decisions on buying and selling stocks must be made. To achieve this level of performance, such systems require dedicated CPU cores that are free from interruptions by other processes, together with wider system tuning.

Tuning 246
article thumbnail

Save Money in AWS RDS: Don’t Trust the Defaults

Percona

Default settings can help you get started quickly – but they can also cost you performance and a higher cloud bill at the end of the month. Want to save money on your AWS RDS bill? I’ll show you some MySQL settings to tune to get better performance, and cost savings, with AWS RDS. Recently I was engaged in a MySQL Performance Audit for a customer to help troubleshoot performance issues that led to downtime during periods of high traffic on their AWS RDS MySQL instances.

AWS 124
article thumbnail

What Is Deep Data Observability?

DZone

This article explains why Deep data observability is different from shallow: deep data observability is truly comprehensive in terms of data sources, data formats, data granularity, validator configuration, cadence, and user focus. The Need for “Deep” Data Observability 2022 was the year when data observability really took off as a category (as opposed to old-school “data quality tools”), with the official Gartner terminology for the space.

article thumbnail

A Complete Guide to Performance Budgets

Speed Curve

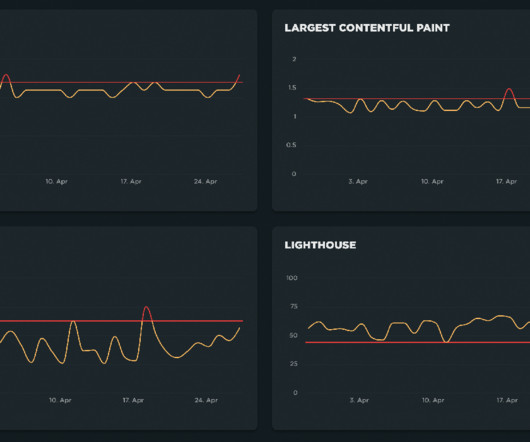
It's easier to make a fast website than it is to keep a website fast. If you've invested countless hours in speeding up your pages, but you're not using performance budgets to prevent regressions, you could be at risk of wasting all your efforts. In this post we'll cover how to: Use performance budgets to fight regressions Understand the difference between performance budgets and performance goals Identify which metrics to track Validate your metrics to make sure they're measuring what you think

article thumbnail

Front-End: Cache Strategies You Should Know

DZone

Caches are very useful software components that all engineers must know. It is a transversal component that applies to all the tech areas and architecture layers such as operating systems, data platforms, backend, frontend, and other components. In this article, we are going to describe what is a cache and explain specific use cases focusing on the frontend and client side.

Cache 141
article thumbnail

PostgreSQL Performance Tuning: Optimizing Database Parameters for Maximum Efficiency

Percona

This blog was originally published in August 2018 and was updated in May 2023. Out of the box, the default PostgreSQL configuration is not tuned for any particular workload. Default values are set to ensure that PostgreSQL runs everywhere, with the least resources it can consume, and so that it doesn’t cause any vulnerabilities. It has default settings for all of the database parameters.

Tuning 52