
Service-level objectives (SLOs) are a great tool to align business goals with the technical goals that drive DevOps (Speed of Delivery) and Site Reliability Engineering (SRE) (Ensuring Production Resiliency).
In a recent workshop I did with a global player in the financial market we used their new mobile banking app as a reference. The business said it wanted to increase the adoption of the new app vs the existing app. The team also wanted to increase the rating of the app which was – by analyzing the reviews – heavily impacted by crashes and slow responsiveness of the current versions. Based on these requirements and status we came up with the following proposal:
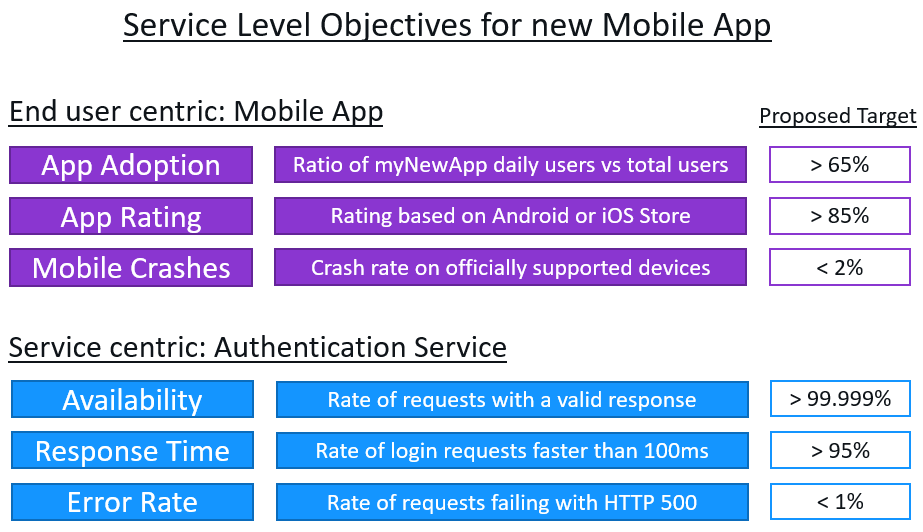
We first focused on the end-user because that’s what the business cares about. Therefore, the first three goals/objectives are all related to the mobile app itself including adoption, app store rating, and crashes. After that, we sat down and derived SLOs that are relevant for the backend services that have an impact on those end user-centric SLOs. We picked the Authentication Service as it’s the one first involved when a user opens the app. If that service is slow, failing, or not available at all it results in frustration mentioned in some of the comments on social media and the app store.
Introduction Objective Driven Development (ODD) for some Business SLOs
You could argue that App Adoption and App Rating are more goals than objectives as the values of today’s adoption and rating numbers are far below the proposed targets. But I would then argue that a goal is objective and therefore we should call it an SLO. The thing to keep in mind is that those SLOs will be RED (=violating the objective) in the beginning, and that you must keep working on it until they hopefully become GREEN (=meeting the objective). It’s the same concept as Test Driven Development (TDD) where you start with tests that will fail until you finish implementing the code so tests will succeed. Maybe we should call it ODD where we define an objective and work towards it.
I think it’s great to define those SLOs and put them on a dashboard you can give to your business. Instead of focusing on the error budget, which doesn’t make sense in this scenario, give them progress indicators so they can see whether you are moving towards or away from your goal. Below is an example of such a simple dashboard.
How to measure those end-user and service focused SLOs with Dynatrace
In the workshop, I also answered the question: How can we measure those metrics (=SLIs) that are behind our objectives? In Dynatrace that’s easy:
App Adoption Rate
Dynatrace’s Real User Monitoring (RUM) offering provides observability to every end-user that uses your mobile or web applications. For the adoption rate of the new vs the old app, we can simply take the number of unique users of the old app and divide it by the unique users of the new app to give you the rating.
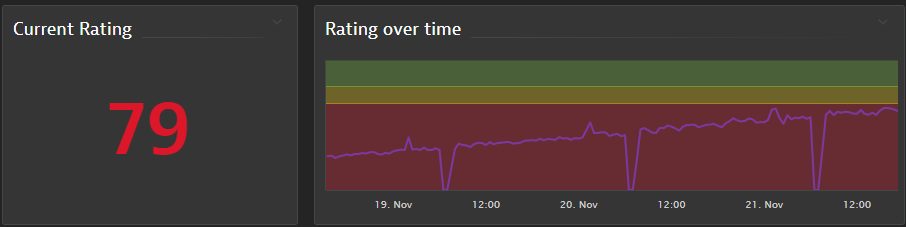
App Rating
Dynatrace provides several ways to ingest data from external data sources. Whether its our Metrics Ingest API or building a Dynatrace Extension. This allows pulling or pushing mobile app ratings through the APIs that Google and Apple offer into Dynatrace. A recent blog from Wolfgang Beer discusses ingesting external data including blogs on SLOs to safeguard mobile app revenue.
Mobile Crashes
Dynatrace’s RUM for Mobile Apps provides crash analytics by default. Besides just a ratio, Dynatrace provides crash details including crash reports and stack traces which are great for developers to analyze and fix issues. For our SLO the only thing we need is the default Mobile Crash Rate metric.
Availability
For availability, I always propose to use Dynatrace Synthetic vs looking at real user traffic. Why? Because Synthetic tests are predictable and eliminate any seasonal behavior or impact of the end user’s environment (defect hardware, bad Wi-Fi, etc.). Dynatrace Synthetic allows us to test API endpoints as well as full end-user browser click paths. They are easy to set up and by default deliver an availability metric we can use for our SLOs.
Response time
Dynatrace automatically monitors the response time of all your services, either through using the Dynatrace OneAgent auto-instrumentation and ability to ingest OpenTelemetry data or by ingesting response time metrics from external sources such as Prometheus. It’s important you get response time metrics for the specific endpoints of a service, e.g., /authenticate. Also debate whether to exclude response time from certain requests, e.g., exclude requests from bogus requests or internal heartbeat requests. Dynatrace allows you to do all that, so you truly get the response time for the SLO you need.
Error rate
The error rate is similar to response time. Dynatrace has your request specific metrics including Error Rate, and allows you to configure what error really means – for example, do you want to include errors that are a result of a user making a typo in their username or not? Probably not. Dynatrace gives you that option, so you can get the exact Error Rate you need for your SLOs.
Creating an SLO dashboard for Business, DevOps, and SREs
Dynatrace’s SLO capability makes it easy to create the SLOs we just discussed. In my workshop, I showed typical SLO dashboards I build. I’m not just adding single or multiple SLOs on a dashboard; instead, for business and DevOps and SRE teams, I like to build a dashboard that shows the same SLO in different timeframes. The screenshot below is an example of this build of the dashboard with an explanation of what each SLO and the respective timeframe tells me:
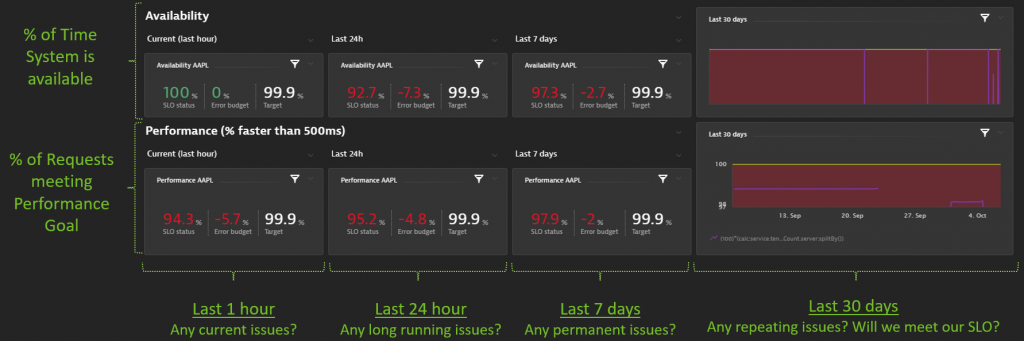
The dashboard layout above is nothing I came up with. I saw this with other customers in the past where they explained how they analyze different timeframes to support tactical and strategical decisions. Simple yet powerful! And Dynatrace supports all this because SLOs can be viewed in different timeframes, either through our SLO tile including error budget or over time with our powerful charts.
From SLO reporting to ensuring business resiliency
What we have walked through so far is rather straightforward you may say. It’s just a bunch of metrics against some thresholds and then we put them on a dashboard in different colors and timeframes, and I agree! There is no real magic! It’s just simple reporting that allows you to react to a problem that’s already known based on those metrics (SLIs) you have specified as SLOs.
Dynatrace’s Davis AI takes SLO up a level; instead of just using it for reporting purposes, Dynatrace alerts on problems that will impact your SLOs before the SLO itself is impacted. This is possible through our automated problem detection and the fact that Dynatrace knows the dependencies of your SLOs to all backend supporting apps, services, and infrastructure. This capability was nicely explained in a recent blog.
Below is a high-level overview of what I often call “Minority report style pre-crime alerting”. It gives you time to act upon a problem before it becomes a real problem.
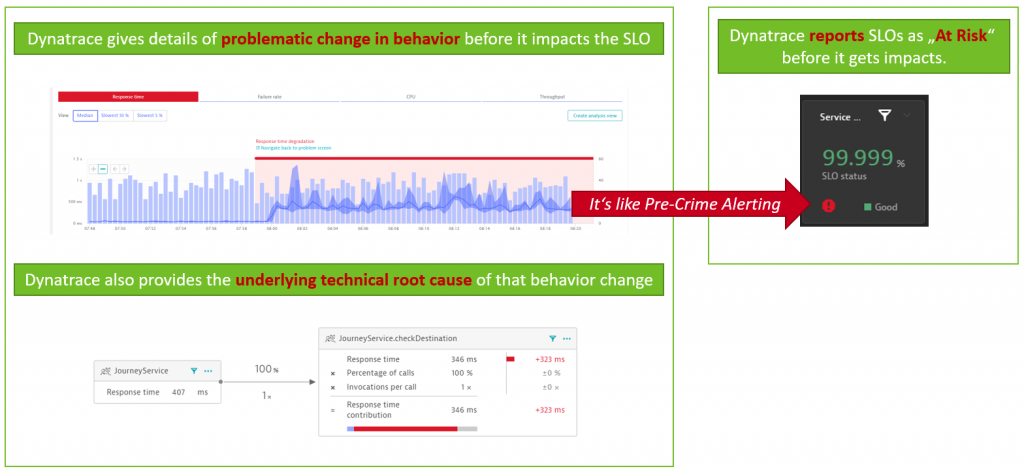
If you are thinking about SLOs, I hope this shows you that SLOs shouldn’t just be used for reporting or reacting to issues when they become apparent based on your error budget burn down. Modern observability coupled with deterministic AI – like Dynatrace offers – enables you to put out a flame before it becomes a fire. Explore how Dynatrace can help you create and monitor SLOs, track error budgets, and predict violations/problems before they occur, so teams can prevent failures and downtime.
Next step: Automating and scaling SLOs across from Ops to Dev
My workshops like with the mentioned customer in the financial sector where we discuss “How to start with SLOs” and “What SLOs are good for me” are just the start. The true power of SLOs comes when everyone in the value creation chain is actively working towards meeting SLOs. This requires a holistic approach to SLOs as part of the development lifecycle and not just being a siloed activity in production.
If you want to learn more, watch my latest Performance Clinic Automating SLOs from Ops to Dev with Dynatrace where I walk through creating your first SLOs, creating SLO dashboards, using SLOs as part of release validation, and ending up providing “SLOs as Code” to developers integrated into their development and delivery process.
If you have any further questions feel free to reach out to me via LinkedIn or Twitter or get in touch with one of my colleagues at Dynatrace whether this is your local Dynatrace account team, your CSM, Dynatrace One, or the Dynatrace community.
To learn more about how Dynatrace does SLOs, check out the on-demand performance clinic, Getting started with SLOs in Dynatrace.

Looking for answers?
Start a new discussion or ask for help in our Q&A forum.
Go to forum