Remove Demo Remove DevOps Remove Metrics Remove Speed
article thumbnail

Unlock the Power of DevSecOps with Newly Released Kubernetes Experience for Platform Engineering

Dynatrace

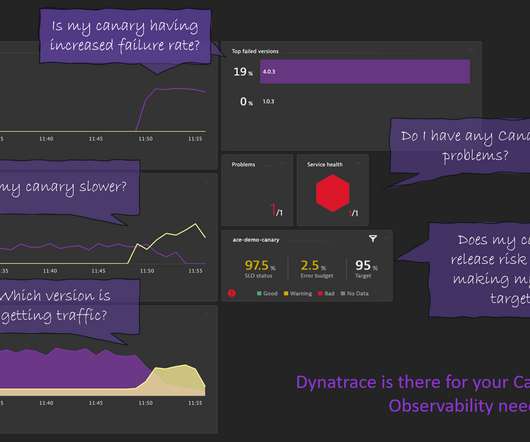
Provide self-service platform services with dedicated UI for development teams to improve developer experience and increase speed of delivery. Open source logs and metrics take precedence in the monitoring process. Automation, automation, automation. Adoption of GitOps practices enables platform provisioning at scale. See for yourself.

article thumbnail

What is full stack observability?

Dynatrace

A full-stack observability solution uses telemetry data such as logs, metrics, and traces to give IT teams insight into application, infrastructure, and UX performance. DevOps teams can also benefit from full-stack observability. With improved diagnostic and analytic capabilities, DevOps teams can spend less time troubleshooting.

DevOps 235
Insiders

Sign Up for our Newsletter

This site is protected by reCAPTCHA and the Google Privacy Policy and Terms of Service apply.

Trending Sources

article thumbnail

A three-step implementation guide to answer-driven SLO-based release validation

Dynatrace

The Dynatrace Software Intelligence Platform already comes with release analysis, version awareness , and Service Level Objective (SLO) support as part of the Dynatrace Cloud Automation solution , helping DevOps and SRE teams automate the delivery and operational decisions. And it’s not just the release validation.

DevOps 245
article thumbnail

Why log monitoring and log analytics matter in a hyperscale world

Dynatrace

DevOps teams often use a log monitoring solution to ingest application, service, and system logs so they can detect issues at any phase of the software delivery life cycle (SDLC). With clear insight into crucial system metrics, teams can automate more processes and responses with greater precision. More automation.

Analytics 214
article thumbnail

Part 2: How Dynatrace and GitHub help you deliver better software faster

Dynatrace

The 2021 State of DevOps report found successful organizations enable application teams to set up and configure monitoring and alerting through self-service capabilities, removing the need for manual work from teams responsible for monitoring. In this example, new tagging rules are shown. The image below also refers to this example.

Software 206
article thumbnail

How to automate Canary Release decisions with Dynatrace

Dynatrace

Progressive Delivery enables speeding up while managing the risk of software deployments and configuration changes. Having metrics with version information, e.g, Dynatrace news. One of the aspects of progressive delivery is using new zero-downtime deployment strategies such as Canary, Blue-Green, or Feature Flags. Step 3: SLOs.

Cloud 236
article thumbnail

Simplify and standardize Dynatrace integration to Jenkins software delivery pipelines with shared libraries

Dynatrace

The Jenkins to Keptn integration was explained and demoed in one of our Performance Clinic videos; “. Environment interfaces include queries for topology, metrics, problems, and user sessions to name a few. These interfaces also allow toolchains to push problem comments, events, and metrics into Dynatrace for monitored entities.

Software 144