
Dynatrace provides automatic and intelligent observability for all telemetry data in one platform. Today, we’re further expanding our open platform with OpenTelemetry trace ingest. This new capability allows for the ingestion of distributed traces from any third-party source that emits OpenTelemetry trace data. This enables organizations to ensure end-to-end observability insights for heterogeneous cloud-native environments.
Today’s highly complex microservices environments require IT operations and SRE teams to observe each service and transaction end-to-end. Any observability blind spot imposes a risk, potentially increasing the time it takes to identify the root cause of a problem and address it.
With the extremely successful OpenTelemetry project (to which Dynatrace actively contributes) having recently reached a key milestone with the OpenTelemetry Tracing Specification version 1.0, cloud service providers are now starting to add OpenTelemetry instrumentation as an out-of-the-box feature. Additionally, more development teams are exploring custom instrumentation of domain- and project-specific diagnostic points using OpenTelemetry.
At Dynatrace, we strive to provide enterprise-grade observability regardless of the data source. As such, we recently opened up our platform for metric ingestion and log monitoring and built integrations for key formats in those spaces.
Announcing OpenTelemetry trace ingest
Today, we’re happy to announce that with the new OpenTelemetry trace ingest capability, we now also provide a standard way of ingesting distributed traces into Dynatrace—regardless of the data source.
This enables you to leverage OpenTelemetry data to gain full visibility in the following scenarios:
- If you have complex cloud-native monitoring environments that involve a fully managed cloud service that only exposes OTLP traces as spans but doesn’t allow for OneAgent deployment
- If your teams are using OpenTelemetry custom instrumentation to enrich monitoring data with project-specific details (for example, to add business data or capture developer-specific diagnostics points), and you want to retain their instrumentation investments
- If your organization uses technologies, including programming languages, that aren’t natively covered by OneAgent, but which do emit OpenTelemetry trace data
Now let’s take a closer look at the first two of these scenarios using a concrete example.
Gain full observability in heterogeneous cloud-native environments and reduce resolution times
TL;DR summary
Say, for example, that during the last couple of hours, the cart-checkout service of your Online Boutique has failed 45% of the time, causing immense user frustration. This service relies on an externally hosted third-party currency-conversion service. OpenTelemetry trace data emitted by this third-party service is ingested into Dynatrace and combined with OneAgent data for PurePath analysis. With this approach you can quickly see that too many requests to the service is the reason why every other request is being dropped. This is the root cause of the service failures and user frustration.
Detailed use case
Say you’re running the Online Boutique, a cloud-native microservices demo application that allows users to browse items, add them to a shopping cart, and purchase them. However, you notice that 100% of users are frustrated, with the Apdex rating down to zero. So, you start your investigation at the front-end server service, which shows an increased failure rate with every second request failing for a couple of hours. When investigating the failure rate, you notice that the cart-checkout service fails 45% of the time. To investigate further, you drill down to the cart-checkout transactions and the actual PurePath, which includes seamlessly integrated OpenTelemetry spans.
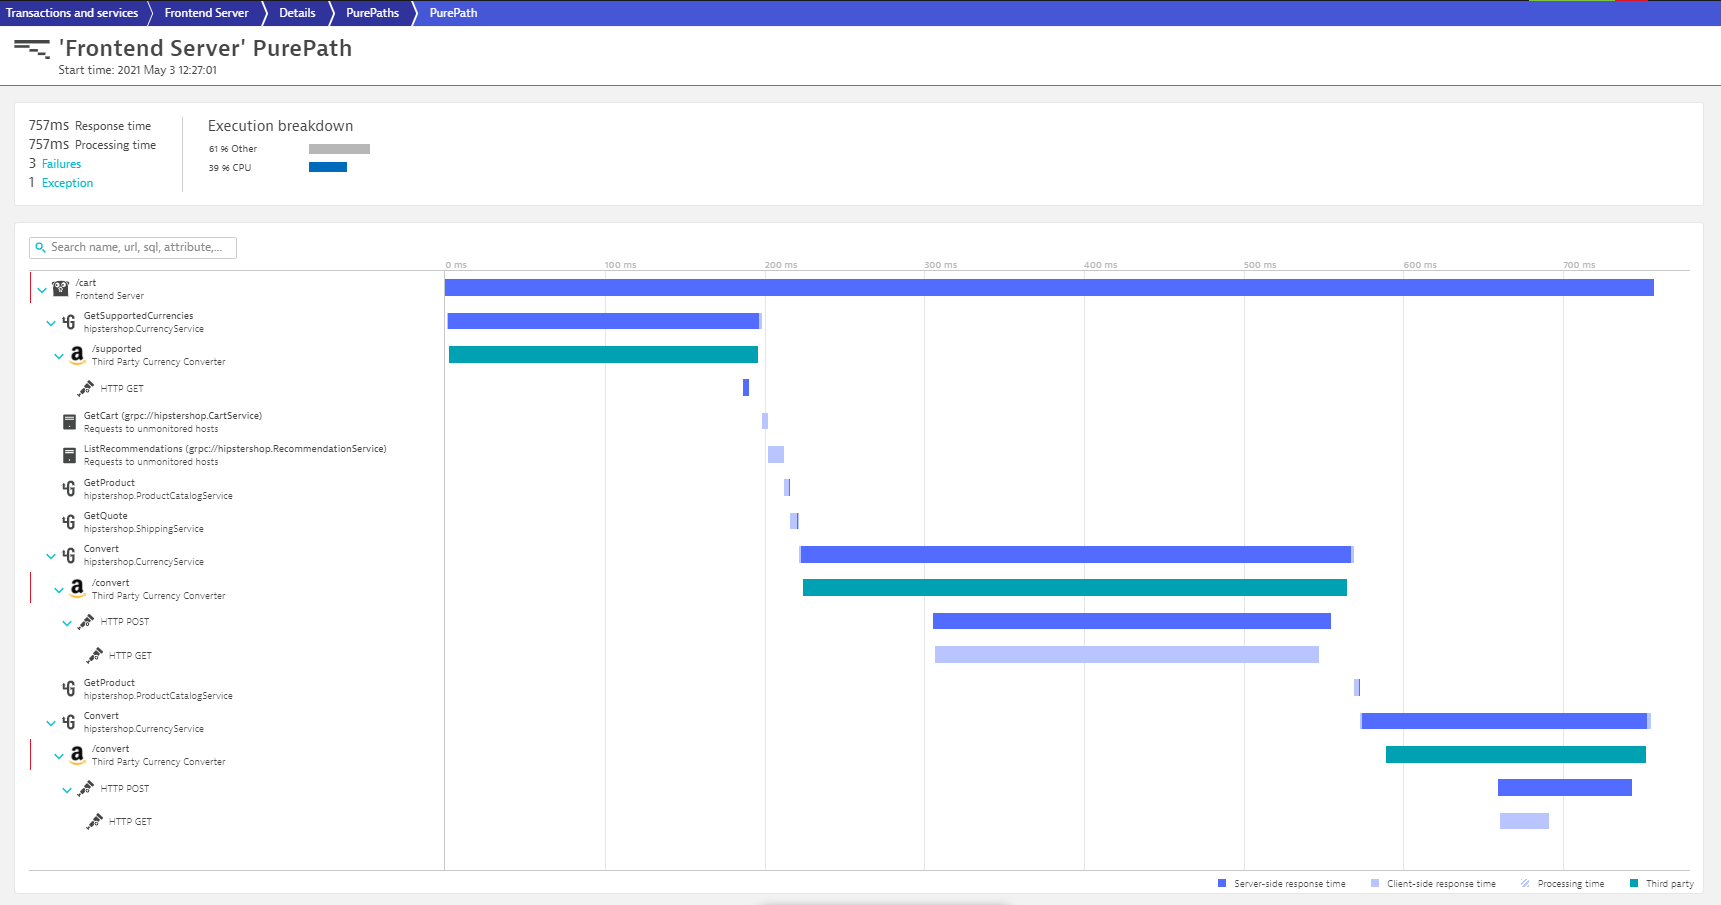
When selecting the cart-checkout service in PurePath view, you see that the service fails with an internal server error. And within the PurePath, Dynatrace also highlights that the call to the third-party currency-conversion service is failing.
This third-party currency-conversion service is hosted externally, and although no OneAgent is deployed there, you can still seamlessly integrate OpenTelemetry trace data emitted by this third-party service by leveraging the new trace ingest API endpoint.
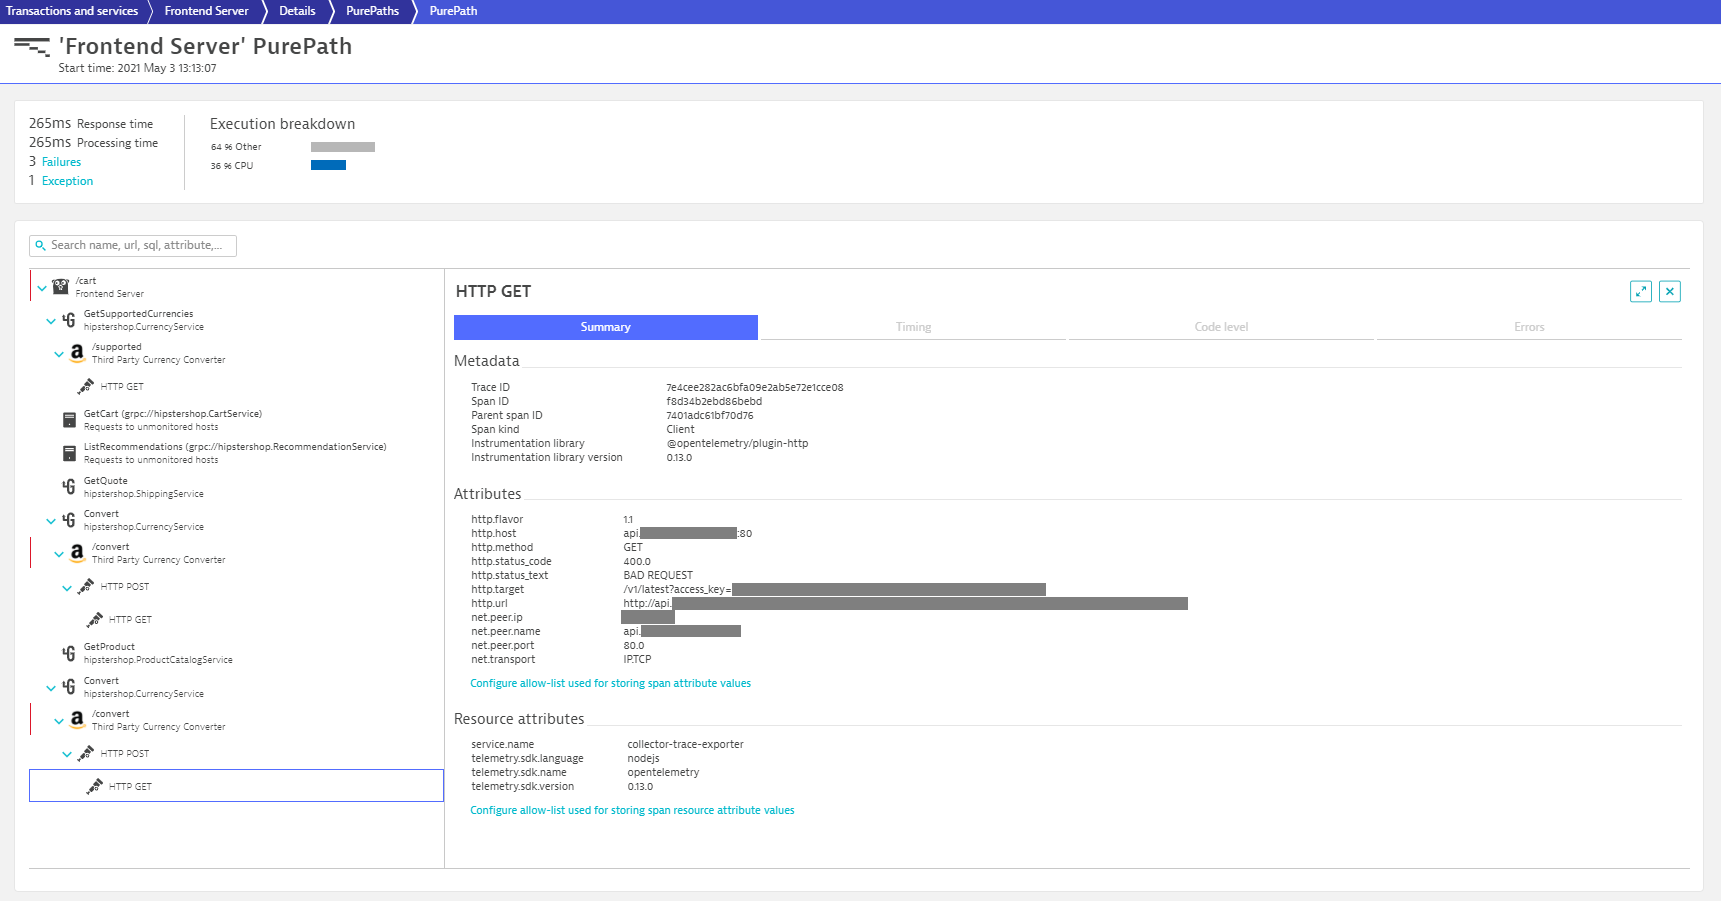
The span attributes emitted for the conversionRequest include the HTTP 400 status code, which tells us that because of too many requests to the service, throttling has kicked in, causing the service failures and user frustration.
This insight into the root cause of the issue allows you to work out a mitigation plan for the service failures by, for example, reaching out to the cloud provider that hosts the third-party service.
However, you’ll also want to reach out to those frustrated users who haven’t been able to successfully place an order in the Online Boutique. With additional user details added via OpenTelemetry custom instrumentation—picked up by OneAgent this time—you can take further action and offer a voucher to those customers for their next order, for example.
This example shows how Dynatrace and OpenTelemetry work better together helping you to achieve observability at scale with automated instrumentation, continuous topology mapping, and causation-based AI.
Meet data privacy requirements and control the scope of stored span data
Dynatrace automatically captures all OpenTelemetry span and resource attributes. However, as span and resource attributes can potentially include sensitive personal information, personally identifiable information (PII), and other sensitive data, Dynatrace only stores span and resource attribute values if you explicitly specify related attribute keys. This enables you to maximize the data protection features that are provided by Dynatrace.
How to get started
Beginning with Dynatrace version 1.222, trace ingest is generally available, and further information on trace ingest can be found in Dynatrace Documentation.
Please share your feedback with us
We’ve set up a feedback channel in the Dynatrace Community. Please use this channel to share your thoughts about the new trace ingest capability. Your feedback is highly appreciated.
What’s next
We’re constantly improving trace ingest. Stay tuned for further updates.


Looking for answers?
Start a new discussion or ask for help in our Q&A forum.
Go to forum