Remove Code Remove Performance Remove Software Performance Remove Storage
article thumbnail

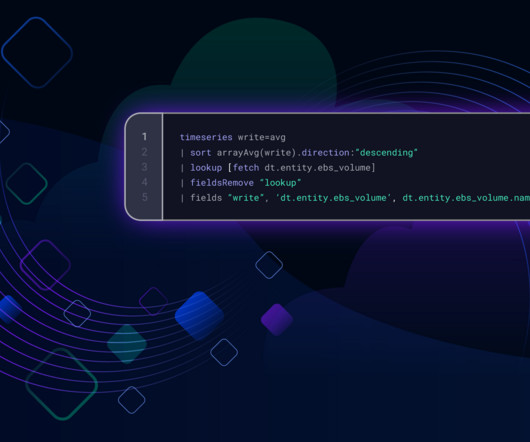
Automate CI/CD pipelines with Dynatrace: Part 2, Deploy stage

Dynatrace

Deploy stage In the deployment stage, the application code is typically deployed in an environment that mirrors the production environment. This step is crucial as this environment is used for the final validation and testing phase before the code is released into production. To illustrate this concept, consider the scenario below.

Traffic 266
article thumbnail

Observability platform vs. observability tools

Dynatrace

With observability, teams can understand what part of a system is performing poorly and how to correct the problem. Metrics are measures of critical system values, such as CPU utilization or average write latency to persistent storage. Traces provide performance data about tasks that are performed by invoking a series of services.

Insiders

Sign Up for our Newsletter

This site is protected by reCAPTCHA and the Google Privacy Policy and Terms of Service apply.

Trending Sources

article thumbnail

Service level objectives: 5 SLOs to get started

Dynatrace

In today’s fast-paced digital landscape, ensuring high-quality software is crucial for organizations to thrive. Service level objectives (SLOs) provide a powerful framework for measuring and maintaining software performance, reliability, and user satisfaction. But the pressure on CIOs to innovate faster comes at a cost.

Latency 182
article thumbnail

Service level objective examples: 5 SLO examples for faster, more reliable apps

Dynatrace

Service level objectives (SLOs) provide a powerful framework for measuring and maintaining software performance, reliability, and user satisfaction. Teams can build on these SLO examples to improve application performance and reliability. But the pressure on CIOs to innovate faster comes at a cost. or 99.99% of the time.

Traffic 173
article thumbnail

What is? OpenTelemetry??An open-source standard for logs, metrics, and traces

Dynatrace

OpenTelemetry (also referred to as OTel) is an open-source observability framework made up of a collection of tools, APIs, and SDKs, that enables IT teams to instrument, generate, collect, and export telemetry data for analysis and understand software performance and behavior. Monitoring begins here. But how is that data generated?

article thumbnail

Understanding Weak Reference In JavaScript

Smashing Magazine

Memory and performance management are important aspects of software development and ones that every software developer should pay attention to. The output of the code above would be the following: WeakMap {{…} => 'done'} man = null; console.log(human). Understanding Weak Reference In JavaScript. Frank Joseph.

Cache 117
article thumbnail

Track Thousands of Assets in a Time of Crisis Using Real-Time Digital Twins

ScaleOut Software

A “real-time digital twin” is a software concept that can track the key parameters for an individual asset, such as a box of masks or a ventilator, and update these parameters in milliseconds as messages flow in from personnel in the field (or directly from smart devices). Which hospital in a given state has the most unused ventilators?”.