Remove Cache Remove Example Remove Hardware Remove Traffic
article thumbnail

Seeing through hardware counters: a journey to threefold performance increase

The Netflix TechBlog

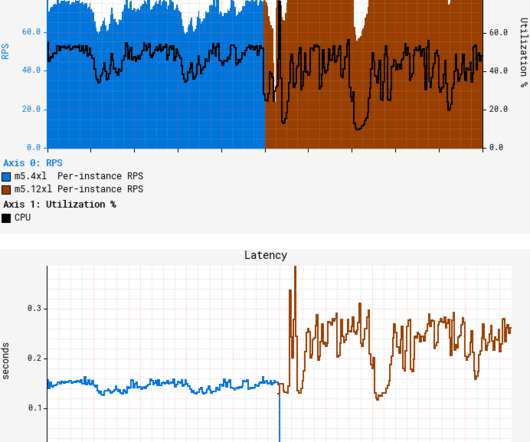
A quick canary test was free of errors and showed lower latency, which is expected given that our standard canary setup routes an equal amount of traffic to both the baseline running on 4xl and the canary on 12xl. We also see much higher L1 cache activity combined with 4x higher count of MACHINE_CLEARS.

Hardware 363
article thumbnail

Crucial Redis Monitoring Metrics You Must Watch

Scalegrid

Effective management of memory stores with policies like LRU/LFU proactive monitoring of the replication process and advanced metrics such as cache hit ratio and persistence indicators are crucial for ensuring data integrity and optimizing Redis’s performance. Cache Hit Ratio The cache hit ratio represents the efficiency of cache usage.

Metrics 130
Insiders

Sign Up for our Newsletter

This site is protected by reCAPTCHA and the Google Privacy Policy and Terms of Service apply.

Trending Sources

article thumbnail

MySQL Capacity Planning

Percona

Or worse yet, sometimes I get questions about regaining normal operations after a traffic increase caused performance destabilization. But we can discuss common bottlenecks, how to assess them, and have a better understanding as to why proactive monitoring is so important when it comes to responding to traffic growth.

Traffic 87
article thumbnail

Compress objects, not cache lines: an object-based compressed memory hierarchy

The Morning Paper

Compress objects, not cache lines: an object-based compressed memory hierarchy Tsai & Sanchez, ASPLOS’19. So while you probably won’t be using Zippads in practice anytime soon, it’s a wonderful example of what’s possible when you’re prepared to take a fresh look at “the way we’ve always done things.” Implications.

Cache 61
article thumbnail

Predictive CPU isolation of containers at Netflix

The Netflix TechBlog

Because microprocessors are so fast, computer architecture design has evolved towards adding various levels of caching between compute units and the main memory, in order to hide the latency of bringing the bits to the brains. This avoids thrashing caches too much for B and evens out the pressure on the L3 caches of the machine.

Cache 251
article thumbnail

MySQL Key Performance Indicators (KPI) With PMM

Percona

Let’s dive in and learn how (and what) to effectively monitor MySQL performance, along with examples from PMM, by understanding the critical KPIs to watch for. This includes metrics such as query execution time, the number of queries executed per second, and the utilization of query cache and adaptive hash index.

article thumbnail

Taiji: managing global user traffic for large-scale Internet services at the edge

The Morning Paper

Taiji: managing global user traffic for large-scale internet services at the edge Xu et al., It’s another networking paper to close out the week (and our coverage of SOSP’19), but whereas Snap looked at traffic routing within the datacenter, Taiji is concerned with routing traffic from the edge to a datacenter. SOSP’19.

Traffic 42