Remove tag visualization
article thumbnail

The right person at the right time makes all the difference: Best practices for ownership information

Dynatrace

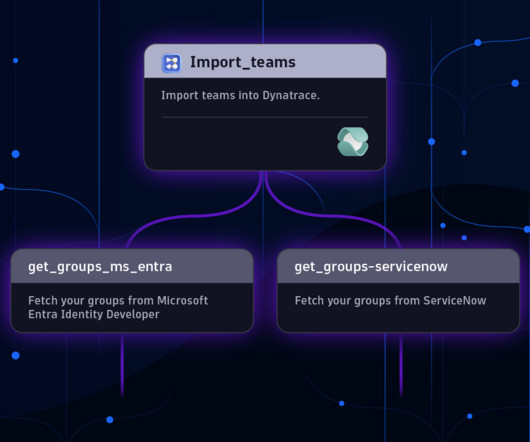
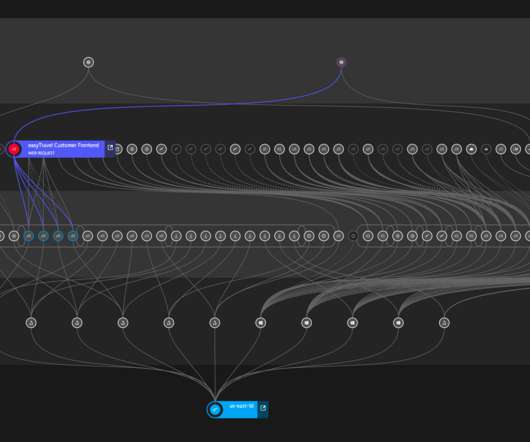
Be it a visual representation or an automated task in a workflow, easily resolving ownership information for services is where the full value becomes noticeable. If certain naming conventions or key-value pairs are already used to tag services or apps with responsible teams, it’s possible to reuse the same keys easily.

article thumbnail

Dynatrace Support for AWS Lambda Functions Powered by x86 and AWS Graviton2

Dynatrace

In addition, Dynatrace visualizes each Lambda function interactive map of how everything is interconnected using our patented Smartscape technology. Choose from any of five visualizations: graph, pie, single value, table, or top list. Add your visualization right to your dashboards for easy access and sharing.

Lambda 218
Insiders

Sign Up for our Newsletter

This site is protected by reCAPTCHA and the Google Privacy Policy and Terms of Service apply.

Trending Sources

article thumbnail

Dynatrace extends contextual analytics and AIOps for open observability

Dynatrace

Relying solely on traditional analysis methods like tagging and data correlation to answer such questions is inadequate when an IT landscape isn’t properly represented in a data model or when the cause-and-effect chain of services remains unclear. Next steps. For more information visit our web page.

Analytics 246
article thumbnail

Upgrade to the Data explorer to level up your data visualizations and analysis

Dynatrace

And so, getting simple visualization use cases done efficiently becomes far from the norm. When looking at the market, we see the following shortcomings of solutions: They’re either good at automated analytics , using AI engines, or at providing visualization/ dashboarding capabilities, but not both.

Metrics 234
article thumbnail

A practical guide to monitoring Python Applications with Dynatrace

Dynatrace

The idea, and most of the content for this blog, comes from one of our Partners; Stephan Dannewitz , DevOps & Site Reliability Engineer at avodaq AG. If you’re developing, testing, operating, or if you’re a business owner of a Python-based application then I encourage you to read the rest of the blog. Yes – that’s it.

article thumbnail

Dynatrace SaaS release notes version 1.231

Dynatrace

Table visualization: You can set a unique threshold for each table column. Single value visualization: Tiles can now show the value trend (based on the first and last datapoints of the selected timeframe). The post Dynatrace SaaS release notes version 1.231 appeared first on Dynatrace blog. Dashboards. APM-329649). APM-332637).

Lambda 199
article thumbnail

Digital Business Analytics: Accelerating your dashboard journey

Dynatrace

Teams need data visualized in different ways so they can make informed decisions. We’re a visual society, which will never change, however simply putting data on a glass without any ability to interact with the data will lead to frustration and is pointless. Smart tagging for easy access. Again, these actions take seconds.

Analytics 173