Remove tag trends
article thumbnail

Dynatrace SaaS release notes version 1.231

Dynatrace

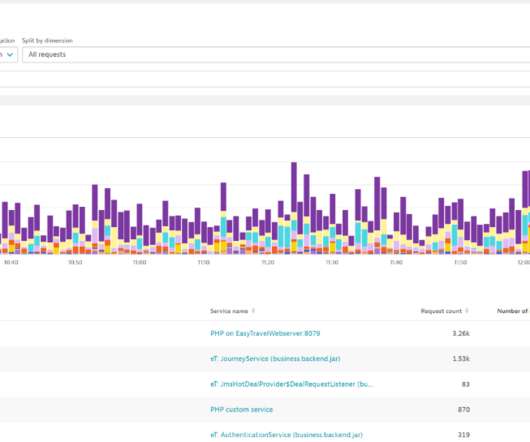
Single value visualization: Tiles can now show the value trend (based on the first and last datapoints of the selected timeframe). Corrected inconsistency between tags in ServiceNow event notifications and tags of the event when the tags changed on the affected entity of the event after event creation. (APM-332637).
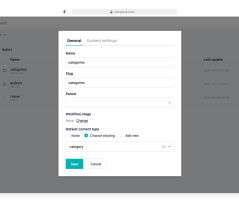
Lambda 196
article thumbnail

Upgrade to the Data explorer to level up your data visualizations and analysis

Dynatrace

With digital systems growing exponentially in size and complexity, industry trends like AIOps and DevSecOps are becoming the norm for application performance m onitoring (APM) and observability tools such as Dynatrace. Alternatively, what if I want to filter all my service key requests by a service with a specific tag?

Metrics 231
Insiders

Sign Up for our Newsletter

This site is protected by reCAPTCHA and the Google Privacy Policy and Terms of Service apply.

Trending Sources

article thumbnail

Slice and dice all Davis AI-detected incidents with our powerful, new problem feed

Dynatrace

Identify trends in your environment with the new, adaptive aggregation chart. Identify trends in your environment with the new, adaptive aggregation chart. You can expect the same performance when you run any filtered query, such as a query into all problems that contain one or more entity tags.

DevOps 155
article thumbnail

Multidimensional analysis 2.0: Analyze, chart, and report on microservices-based metrics without code changes

Dynatrace

Analyze only services that matter by filtering them by service tags, a management zone, or a request attribute. The example below shows how a travel agency charts the revenue trends of their most popular travel destinations and by loyalty status. Stay tuned for parts 2 and 3 of this blog series. Important to know.

Metrics 160
article thumbnail

Optimize mobile app performance, adoption, and conversions with Session Replay and business analytics

Dynatrace

Now you can easily use Dynatrace in combination with classic tools like Adobe Analytics, Google Analytics, or Intercom by linking Dynatrace data to third-party data sources, including revenue trends, customer conversions, churn, and app store ratings. By having clarity on the source of the problem, you can immediately identify solutions.

Analytics 208
article thumbnail

AWS EKS Monitoring as a Self-Service with Dynatrace

Dynatrace

Robert allowed me to take a couple of screenshots from their Dynatrace environment and with that, in this blog I try to explain how Dynatrace gives them MaaSS for Developers, Operators, DevOps as well as Business. They can be converted to tags which act for filtering and access control. PostgreSQL & Elastic for data storage.

AWS 128
article thumbnail

How digital experience monitoring helps deliver business observability

Dynatrace

RUM is passive monitoring that measures a user’s interactions with an application — typically with a JavaScript tag for web applications or a software development kit (SDK) for native mobile apps. The post How digital experience monitoring helps deliver business observability appeared first on Dynatrace blog.