Remove tag cpu
article thumbnail

Boost application performance with improved CPU analysis across all your deep-monitored workloads

Dynatrace

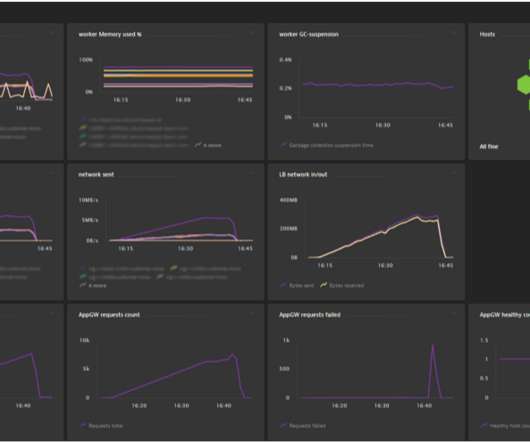
Analyzing and optimizing CPU consumption has always been an important concern. While in classic bare-metal stacks CPU resources are made “available” through over-provisioning, in modern SaaS environments you only pay for those CPU resources that you use—no over-provisioning of resources is required. Dynatrace news.

article thumbnail

Tutorial: Guide to automated SRE-driven performance engineering

Dynatrace

In this blog, I will be going through a step-by-step guide on how to automate SRE-driven performance engineering. This is what this blog is all about. Its a detailed tutorial blog that explains how you can make the first steps towards SLI/SLO-based Quality Gates. For this blog I will be using the same Node.js

Insiders

Sign Up for our Newsletter

This site is protected by reCAPTCHA and the Google Privacy Policy and Terms of Service apply.

Trending Sources

article thumbnail

Dynatrace Support for AWS Lambda Functions Powered by x86 and AWS Graviton2

Dynatrace

For example, you can apply filters on different tag values by using a combination of AWS tags to identity Graviton2 versus x86 Lambda functions as shown below. The post Dynatrace Support for AWS Lambda Functions Powered by x86 and AWS Graviton2 appeared first on Dynatrace blog. Dynatrace Data explorer. End-to-end visibility.

Lambda 213
article thumbnail

Dynatrace Managed release notes version 1.200

Dynatrace

Two fixes have been delivered in this ticket: – Sessions can now be replayed from specific user actions on the Session details page – For user tags that contain a slash (/) character, users can navigate from the Session details page to the User details page by using breadcrumbs. APM-248368). APM-247271). Autonomous Cloud.

Azure 243
article thumbnail

Connect Fluentd logs with Dynatrace traces, metrics, and topology data to enhance Kubernetes observability

Dynatrace

Processing plugins parse (normalize), filter, enrich (tagging), format, and buffer log streams. Both approaches automatically add pod name, namespace, container name, tags, labels, and more to each log file. Output plugins deliver logs to storage solutions, analytics tools, and observability platforms like Dynatrace.

Metrics 179
article thumbnail

Kubernetes And Kernel Panics

The Netflix TechBlog

This blog post shows how to connect the dots from the worst case scenario (a kernel panic) through to Kubernetes (k8s) and eventually up to us operators so that we can track how and why our k8s nodes are going away. These orphaned pods represent real pain for our users, even if they are a small percentage of the total pods in the system.

Hardware 228
article thumbnail

Digital Business Analytics: Accelerating your dashboard journey

Dynatrace

If I’m viewing a dashboard that tells me I have a CPU spike and I have no ability to interact with the data and get answers, what value have I provided with this dashboard? The BizOps Configurator utilizes smart tagging which makes finding the right dashboard at the right time a breeze. Smart tagging for easy access.

Analytics 170