Remove tag chrome-timeline
article thumbnail

The Humble ` ` Element And Core Web Vitals

Smashing Magazine

If using 11ty for your static sites, try the 11ty high-performance blog template. You can find it in the Chrome DevTools suite of debugging tools and run it against any web page, public or requiring authentication. Twitter capped their image fidelity at 2x, resulting in 33% faster timeline image loading times. The Basics.

Media 145
article thumbnail

Progress Delayed Is Progress Denied

Alex Russell

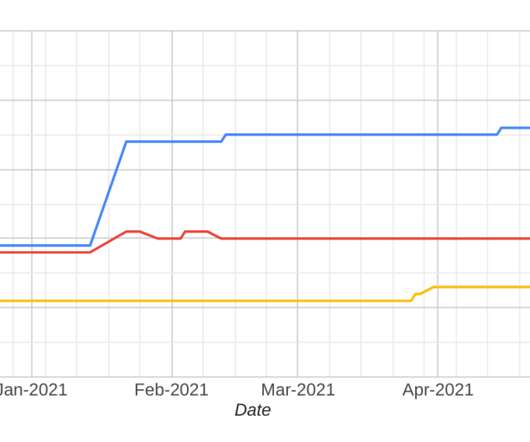
Conversely, the much lower Chrome and Firefox lines indicate that Blink and Gecko are much more likely to both agree and be correct regarding implementations of core web standards [6]. The data is challenging to compare across those graphs, so I extracted it to produce a single chart : Chrome. Where Chrome Has Lagged.

Media 145
Insiders

Sign Up for our Newsletter

This site is protected by reCAPTCHA and the Google Privacy Policy and Terms of Service apply.

Trending Sources

article thumbnail

Load scripts async

Speed Curve

This blog post has a simple conclusion: Load script asynchronously! What we see is that the HTML parser stops when it encounters a SCRIPT tag until that script is downloaded, parsed, and executed. Because the HTML parser stopped, all network traffic also stopped (because no other HTML tags were parsed to initiate HTTP requests).

article thumbnail

Optimizing Web Performance: Understanding Waterfall Charts

Dotcom-Montior

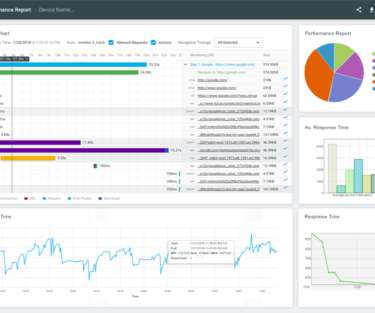
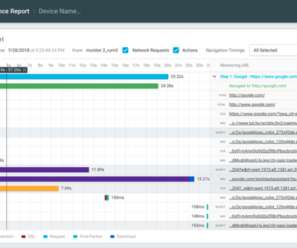
Waterfall charts are diagrams which represent how website resources are being downloaded, parsed by the engine, in a timeline that gives us the opportunity to see the sequence and dependencies between resources. This is the first phase of the timeline. Some of the phases are presented below: Receiving. Queued request. DNS lookup.

article thumbnail

Front-End Performance Checklist 2021

Smashing Magazine

To get a good first impression of how your competitors perform, you can use Chrome UX Report ( CrUX , a ready-made RUM data set, video introduction by Ilya Grigorik and detailed guide by Rick Viscomi), or Treo , a RUM monitoring tool that is powered by Chrome UX Report. You can create your own on Chrome UX Dashboard.

article thumbnail

Optimizing Web Performance: Understanding Waterfall Charts

Dotcom-Montior

Waterfall charts are diagrams which represent how website resources are being downloaded, parsed by the engine, in a timeline that gives us the opportunity to see the sequence and dependencies between resources. Browser (Chrome, Firefox, Internet Explorer, mobile browsers etc…). This is the first phrase of the timeline.