Remove leverage-browser-caching
article thumbnail

Automate configuration changes by leveraging the extended Real User Monitoring APIs

Dynatrace

The need for automation often becomes evident right after setting up your first Real User Monitoring applications, be they for your mobile or web applications, when you realize you want to leverage previous RUM configurations in a new application. Easily manage the configuration of your mobile apps.

article thumbnail

How to Optimize Digital Experience and Operations with Dynatrace

Dynatrace

A well-established metric we provide is APDEX , which tell us how users are perceiving page load times (time to the first byte, page speed, speed index), errors (JavaScript errors, crashes,) and also factors in the overall user journey (each user interaction) including their environment (browser, geolocation, bandwidth).

Cache 197
Insiders

Sign Up for our Newsletter

This site is protected by reCAPTCHA and the Google Privacy Policy and Terms of Service apply.

Trending Sources

article thumbnail

Azure Well-Architected Framework: What it is and how to tame it with AI and automation

Dynatrace

In this blog, we’ll review the five pillars of the Azure Well-Architected Framework and illustrate how organizations can use Dynatrace to ensure their applications are architected correctly. Missing caching layers. Getting precise root cause analysis when dealing with several layers of virtualization in a containerized world.

Azure 187
article thumbnail

What is session replay? Discover user pain points with session recordings

Dynatrace

What users see in their browser window and the underlying HTML code are both governed by the DOM, which creates a tree-like structure for all HTML elements. Streamlined asset caching: Asset caching is critical for creating accurate replays. Discover user pain points with session recordings appeared first on Dynatrace blog.

Mobile 246
article thumbnail

Optimizing Web Performance: Understanding Waterfall Charts

Dotcom-Montior

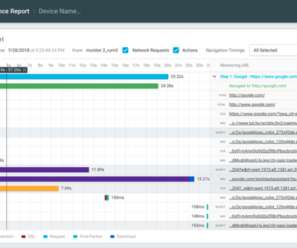
Users can also watch the actual URL loading video in the browser window. It’s important to mention that within the Dotcom Monitor platform there is a feature that a user can watch the actual URL loading video in the browser window (shown below). Moreover, caching utility may decrease the waiting time. Queued request.

article thumbnail

Optimizing Web Performance: Understanding Waterfall Charts

Dotcom-Montior

Users can also watch the actual URL loading video in the browser window. Browser (Chrome, Firefox, Internet Explorer, mobile browsers etc…). Browser (Chrome, Firefox, Internet Explorer, mobile browsers etc…). Moreover, caching utility may decrease the waiting time. Test Location. Connection. Number of Tests.

article thumbnail

I Used The Web For A Day On A 50 MB Budget

Smashing Magazine

MB , that suggests I’ve got around 29 pages in my budget, although probably a few more than that if I’m able to stay on the same sites and leverage browser caching. There’s a trade-off to be made here, as external stylesheets can be cached but inline ones cannot (unless you get clever with JavaScript ). What a mess!

Cache 96