Remove Best Practices Remove Blog Remove Network Remove Traffic
article thumbnail

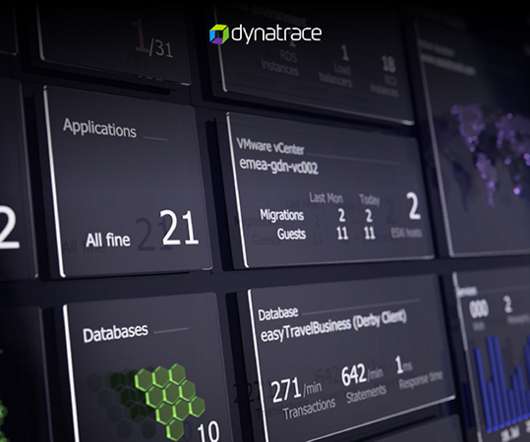
AWS observability: AWS monitoring best practices for resiliency

Dynatrace

These challenges make AWS observability a key practice for building and monitoring cloud-native applications. Let’s take a closer look at what observability in dynamic AWS environments means, why it’s so important, and some AWS monitoring best practices. AWS monitoring best practices. AWS Lambda.

article thumbnail

WordPress VIP For Website Development: Revolutionizing Enterprise Growth!

Official Blog - World Web Technology

It is a premium managed hosting service explicitly designed for high-traffic and high-profile websites. Performance scalability: Using WordPress VIP, users can handle significant traffic and sudden visitor spikes. It controls content delivery networks (CDNs), advanced caching, and other optimization procedures.

Website 59
Insiders

Sign Up for our Newsletter

This site is protected by reCAPTCHA and the Google Privacy Policy and Terms of Service apply.

Trending Sources

article thumbnail

It’s time to migrate from NAM to Dynatrace

Dynatrace

For two decades, Dynatrace NAM—Network Application Monitoring, formerly known as DC RUM—has been successfully monitoring the user experience of our customers’ enterprise applications. SNMP managed the costs of network links well, but not the sources of those costs (i.e., Dynatrace news. Performance has always mattered.

Network 165
article thumbnail

What is cloud migration?

Dynatrace

We’ll answer that question and explore cloud migration benefits and best practices for how to go through your migration smoothly. In case of a spike in traffic, you can automatically spin up more resources, often in a matter of seconds. Likewise, you can scale down when your application experiences decreased traffic.

Cloud 160
article thumbnail

Lessons learned from enterprise service-level objective management

Dynatrace

To ensure their global service levels, they fully embraced the best practices outlined in Google’s SRE handbook , called the “Four Golden Signals,” to standardize what they show on their SRE dashboards. This represents the total number of requests across the network. This refers to the load on your network and servers.

article thumbnail

What is log management? How to tame distributed cloud system complexities

Dynatrace

Logs are among the most effective ways to gain comprehensive visibility into your network, operating systems, and applications. Logs provide detailed information about the data that traverses a network and which parts of applications are running the most. Log management best practices for improved performance.

Systems 180
article thumbnail

MySQL Key Performance Indicators (KPI) With PMM

Percona

In this blog, we will explore various MySQL KPIs that are basic and essential to track using monitoring tools like PMM. PMM captures the MySQL connection matrix It is important to provide appropriate max_connections and also monitor max_used_connections, max_used_connections_time to review the history of max usage to estimate the traffic.