
Many Dynatrace monitoring environments now include well beyond 10,000 monitored hosts—and the number of processes and services has multiplied to millions of monitored entities.
Our REST APIs are widely used to enrich custom reports with performance and stability insights into monitored application environments. With the Dynatrace version 1.166 release, we’re proud to announce major improvements to our REST APIs that will support you in keeping up with the large number of individual processes and services that can be queried through the API.
We’ve improved all our major REST API queries so that they now offer convenient and effective filters for selecting relevant subsets of your monitored entities.
API improvements accelerate queries across millions of entities
This blog post introduces the new REST API improvements and some best practices for streamlining API requests and decreasing load on the API by reducing the number of requests required for reporting and reducing the network bandwidth required for implementing common API use cases.
Best practice: Filter results with management zones or tag filters
Let’s begin with a simple example of generating a report of all hosts that Dynatrace monitors within a specific management zone.
The image below shows the API Explorer documentation for the required REST API endpoint /entity/infrastructure/hosts:
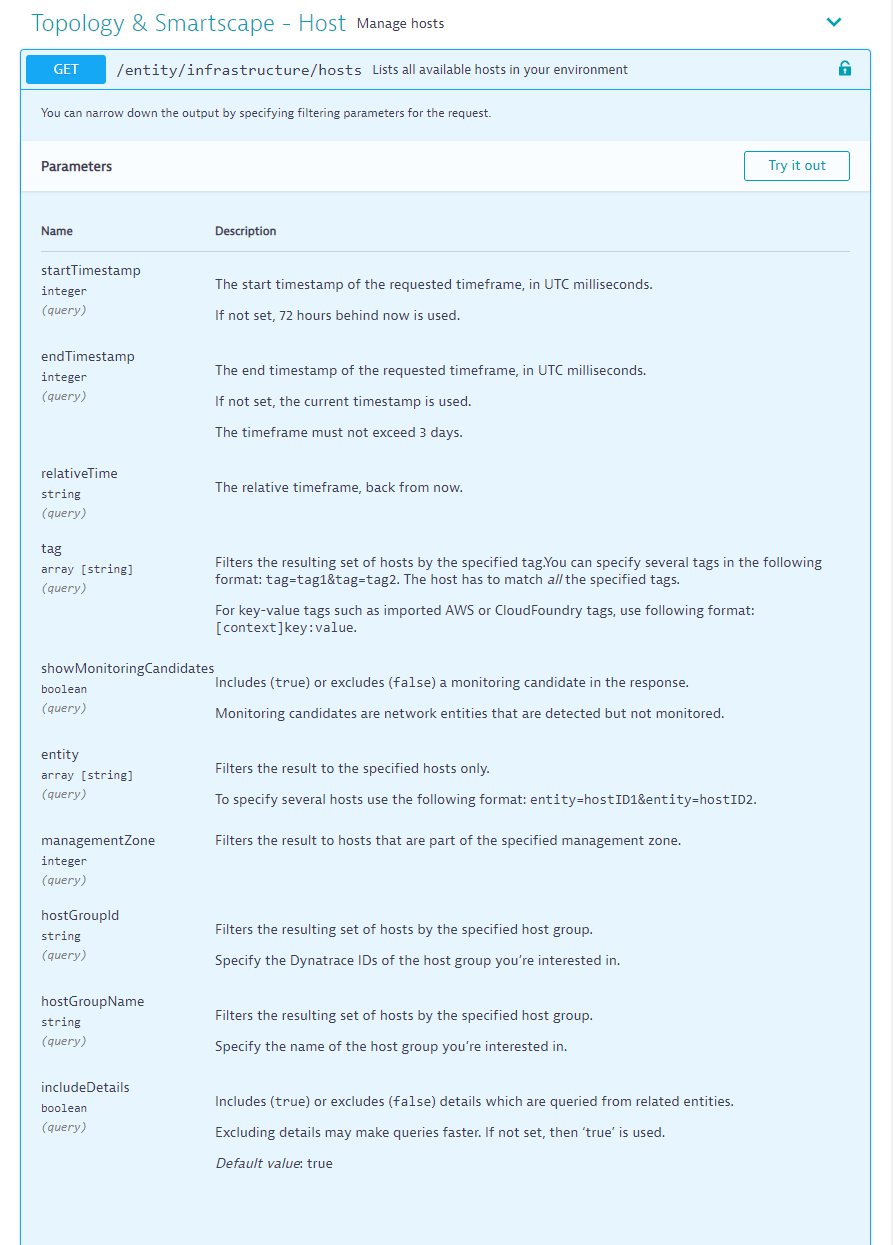
The first and most important filter that you should use in this case is the management zone filter, which allows you to quickly filter all monitored hosts to a smaller subset of hosts within a given management zone.
Instead of fetching megabytes of host information in JSON format, you can use this filter to speed up your query and greatly reduce the size of the resulting payload.
If your environment is organized with tags, you can add tag filters to further reduce the result set and to speed up the query.
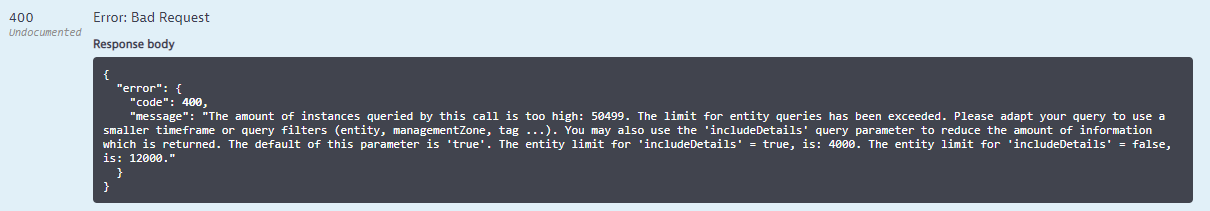
The REST API now informs you early on about any technical limits that your requests run into. Instead of waiting for a timeout, you now receive a quick response that informs you of the limits and workarounds you should use to reduce the result size (see example below).
Best practice: Increase result set limits by reducing details
An overall result set limit has been introduced to guarantee the stability of our APIs. The limit for queries that include relationships is 4,000 entities. You can increase the limit by excluding relationship details—without querying relationship details, the result set limit is greater than 12,000 entities.
A query of the topology, such as a hosts query, delivers the relationships each host has in real-time. Relationships are expensive to query and should be avoided if the information isn’t needed for reporting purposes. By simply specifying includeDetails=false, you can opt out of the relationship query and increase the number of results to the much higher limit of 12,000 entities.
Best practice: Reduce bandwidth consumption by caching and keeping information
We often see API client scripts that query all topology information on a per-minute basis. This introduces several undesirable byproducts, such as a huge impact on the bandwidth in your own data center. Host and service details typically don’t change from minute to minute, so try to cache that information across multiple API calls to reduce the bandwidth required for API calls.
Best practice: Reduce load by distributing reports generation over time
Bursts of huge numbers of calls against the API should be avoided if they aren’t required for your use case. An example of this is the generation of numerous monthly reports that don’t have to perform all their thousands of requests during the same time frame. A best practice here is to increase the time dedicated for the generation of all reports to avoid performing a “load test” of the Dynatrace API.
Dynatrace SaaS environments safeguard their operability by enforcing certain limits on the number of API calls that a script can perform within a minute. The limit of 50 requests per minute helps us provide stable service for all API clients.
To adapt your API client to respect the API limit, the Dynatrace API returns the current allowed number of requests within the result HTTP header:
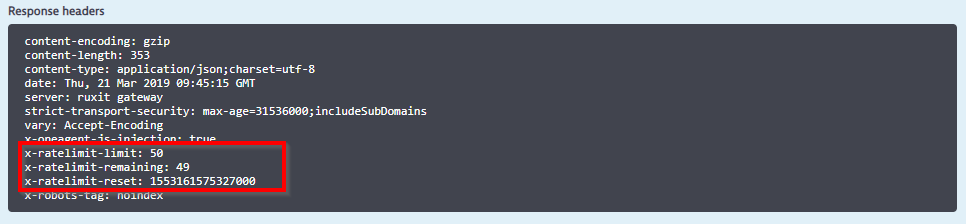
The header x-ratelimit-remaining shows you how many requests your client can execute within the current minute while the x-ratelimit-reset timestamp informs you when the limit will be reset to full capacity.
Please note that the limit spans across all your clients and API tokens, so all your API clients share those 50 requests per minute.
We don’t enforce such a limit within Dynatrace Managed as Managed clusters run exclusively within your own data center.
Best practice: Get the information you need faster with advanced filtering
The final best practice you should consider focuses again on the amount of information you query through the API. If you need to get all the process information about a running host, you should only query the processes that belong to that host.
The Dynatrace API offers several convenient filters that allow you to focus only on information that relates to a logical parent entity, such as a host or a service.
Typical use cases here are fetching all the processes of a given parent host or fetching all key service method metrics of a parent service or application.
The example query below shows how to filter all the processes of a given parent host:
https://{YOUR_ENVIRONMENT_ID}.live.dynatrace.com/api/v1/entity/infrastructure/processes?host=HOST-8D60FEA9C896497DNaturally, this query is much faster than querying all 100,000 processes and then filtering the result on the client side.
The same strategy can be applied to the Timeseries API when fetching metric data points for creating charts within your reports.
To query the number of requests for each key transaction of a given service, use the following example:
https://{YOUR_ENVIRONMENT_ID}.live.dynatrace.com/api/v1/timeseries/com.dynatrace.builtin:servicemethod.requests?aggregationType=count&relativeTime=day&includeData=true&service=SERVICE-42C0B06C4DCFD0EFThe query results in one timeseries of data points for the key transaction on the parent service with the ID SERVICE-42C0B06C4DCFD0EF:
{
"timeseriesId": "com.dynatrace.builtin:servicemethod.requests",
"displayName": "Service method requests",
"dimensions": [
"SERVICE_METHOD"
],
"unit": "Count (count)",
"detailedSource": "Services",
"types": [],
"dataResult": {
"dataPoints": {
"SERVICE_METHOD-3075C47B3562CEEB": [
[
1553083200000,
204
],
[
1553083800000,
204
],
[
1553084400000,
207
],
[
1553169600000,
69
]
]
},
"unit": "Count (count)",
"resolutionInMillisUTC": 600000,
"aggregationType": "COUNT",
"entities": {
"SERVICE_METHOD-3075C47B3562CEEB": "/"
},
"timeseriesId": "com.dynatrace.builtin:servicemethod.requests"
},
"aggregationTypes": [
"COUNT"
],
"filter": "BUILTIN"
}
Leverage the improved Dynatrace APIs for automation and data export at scale
The release of Dynatrace version 1.166 introduced several improvements in terms of query performance on the API. Existing filters such as management zones, tags, or entity filters underwent a huge performance improvement, while we also introduced some more technical limits to safeguard the stability of our servers and of the API in general.
This post also detailed several best practices that you should consider during the design of client scripts to reduce the stress – not only on the Dynatrace Cluster but also on your own network bandwidth.
For more information about using the Dynatrace API to automate your monitoring tasks and export different types of data into your third-party reporting and analysis tools, please visit our API documentation.
If you’re a Dynatrace customer or partner who is interested in further extending our open software intelligence platform, visit our Dynatrace Developer portal so that you can build custom monitoring and AIOps solutions powered by Dynatrace.


Looking for answers?
Start a new discussion or ask for help in our Q&A forum.
Go to forum