Remove Availability Remove Hardware Remove Latency Remove Metrics
article thumbnail

Seeing through hardware counters: a journey to threefold performance increase

The Netflix TechBlog

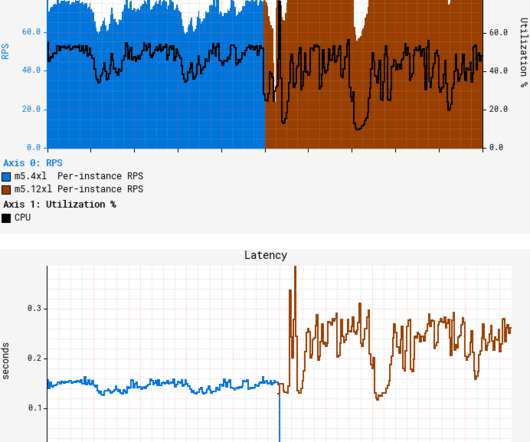
At Netflix, we periodically reevaluate our workloads to optimize utilization of available capacity. A quick canary test was free of errors and showed lower latency, which is expected given that our standard canary setup routes an equal amount of traffic to both the baseline running on 4xl and the canary on 12xl. let’s call it GS2?—?to

Hardware 363
article thumbnail

Crucial Redis Monitoring Metrics You Must Watch

Scalegrid

You will need to know which monitoring metrics for Redis to watch and a tool to monitor these critical server metrics to ensure its health. Redis returns a big list of database metrics when you run the info command on the Redis shell. You can pick a smart selection of relevant metrics from these.
Metrics 130
Insiders

Sign Up for our Newsletter

This site is protected by reCAPTCHA and the Google Privacy Policy and Terms of Service apply.

Trending Sources

article thumbnail

Dynatrace Managed turnkey Premium High Availability for globally distributed data centers (Early Adopter)

Dynatrace

Dynatrace Managed is intrinsically highly available as it stores three copies of all events, user sessions, and metrics across its cluster nodes. The network latency between cluster nodes should be around 10 ms or less. Turnkey high availability across globally distributed data centers. Dynatrace news.

article thumbnail

What is observability? Not just logs, metrics and traces

Dynatrace

In IT and cloud computing, observability is the ability to measure a system’s current state based on the data it generates, such as logs, metrics, and traces. If you’ve read about observability, you likely know that collecting the measurements of logs, metrics, and distributed traces are the three key pillars to achieving success.

Metrics 363
article thumbnail

Redis® Monitoring Strategies for 2024

Scalegrid

Buckle up as we delve into the world of Redis® monitoring, exploring the most important Redis® metrics, discussing essential tools, and even peering into the future of Redis® performance management. Identifying key Redis® metrics such as latency, CPU usage, and memory metrics is crucial for effective Redis monitoring.

Strategy 130
article thumbnail

Cloud infrastructure monitoring in action: Dynatrace on Dynatrace

Dynatrace

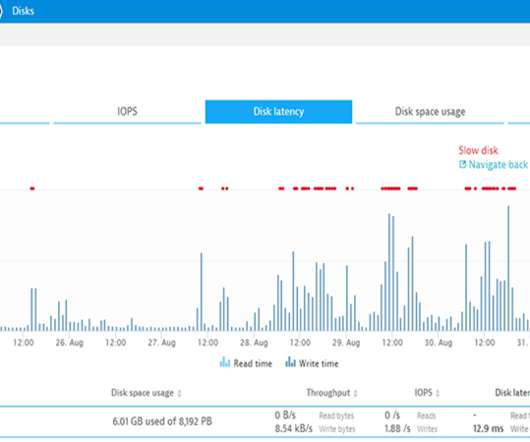
Since we moved to AWS in May 2014 we have had an availability of 99.95%! Sydney, we have a disk write latency problem! It was on August 25 th at 14:00 when Davis initially alerted on a disk write latency issues to Elastic File System (EFS) on one of our EC2 instances in AWS’s Sydney Data Center.

article thumbnail

What is serverless computing? Driving efficiency without sacrificing observability

Dynatrace

This allows teams to sidestep much of the cost and time associated with managing hardware, platforms, and operating systems on-premises, while also gaining the flexibility to scale rapidly and efficiently. Every time the trigger executes, the function runs on an available resource. This creates latency when they need to restart.