Remove Availability Remove Event Remove Infrastructure Remove Java
article thumbnail

How Red Hat and Dynatrace intelligently automate your production environment

Dynatrace

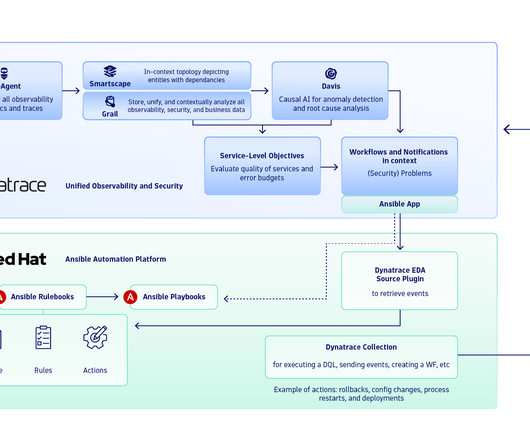
Integration with Red Hat Event-Driven-Ansible will also leverage Red Hat’s flexible rulebook system to map event data, such as problem categories or vulnerability identification, to the correct job template. Dynatrace Davis AI identifies the problem and maps the configuration change event to the root cause and the correct entity.

DevOps 290
article thumbnail

Dynatrace extends AI-powered observability for SAP together with PowerConnect

Dynatrace

Monitoring SAP products can present challenges Monitoring SAP systems can be challenging due to the inherent complexity of using different technologies—such as ABAP, Java, and cloud offerings—and the sheer amount of generated data. SAP HANA server infrastructure monitored with OneAgent.

Java 194
Insiders

Sign Up for our Newsletter

This site is protected by reCAPTCHA and the Google Privacy Policy and Terms of Service apply.

Trending Sources

article thumbnail

Kubernetes in the wild report 2023

Dynatrace

Findings provide insights into Kubernetes practitioners’ infrastructure preferences and how they use advanced Kubernetes platform technologies. Kubernetes infrastructure models differ between cloud and on-premises. Java, Go, and Node.js Kubernetes infrastructure models differ between cloud and on-premises.

article thumbnail

Dynatrace and Google unleash cloud-native observability for GKE Autopilot

Dynatrace

GKE Autopilot empowers organizations to invest in creating elegant digital experiences for their customers in lieu of expensive infrastructure management. These CSI pods provide a unique way of solving a handful of infrastructure problems. Agent logs security. The CSI pod is mounted to application pods using an overlay file system.

Google 225
article thumbnail

How a data lakehouse brings data insights to life

Dynatrace

For IT infrastructure managers and site reliability engineers, or SREs , logs provide a treasure trove of data. These traditional approaches to log monitoring and log analytics thwart IT teams’ goal to address infrastructure performance problems, security threats, and user experience issues. where an error occurred at the code level.

Analytics 226
article thumbnail

Log auditing and log forensics benefit from converging observability and security data

Dynatrace

Log auditing—and its investigative partner, log forensics—are becoming essential practices for securing cloud-native applications and infrastructure. As organizations adopt more cloud-native technologies, observability data—telemetry from applications and infrastructure, including logs, metrics, and traces—and security data are converging.

Analytics 190
article thumbnail

Dynatrace simplifies OpenTelemetry metric collection for context-aware AI analytics

Dynatrace

OpenTelemetry SDKs are available for most contemporary programming languages, such as C++, Go, Java, JavaScript, and Python (see [link] for the full list). Kubernetes workload pages offer resource analysis, lists of services, pods, events, and logs. The same page provides further analysis with workload logs and events.

Analytics 286