Remove Availability Remove Design Remove Latency Remove Network
article thumbnail

Dynatrace Managed turnkey Premium High Availability for globally distributed data centers (Early Adopter)

Dynatrace

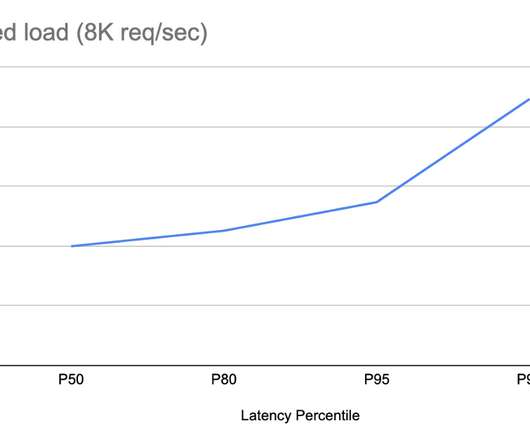
Dynatrace Managed is intrinsically highly available as it stores three copies of all events, user sessions, and metrics across its cluster nodes. The network latency between cluster nodes should be around 10 ms or less. Minimized cross-data center network traffic. Dynatrace news.

article thumbnail

Resilience Pattern: Circuit Breaker

DZone

The circuit breaker is a design pattern that prevents cascading failures and improves the overall availability and performance of a system. A dependency can become unhealthy or unavailable for various reasons, such as network failures, high latency, timeouts, errors, or overload. What Is a Circuit Breaker?

Latency 258
Insiders

Sign Up for our Newsletter

This site is protected by reCAPTCHA and the Google Privacy Policy and Terms of Service apply.

Trending Sources

article thumbnail

The Three Cs: Concatenate, Compress, Cache

CSS Wizardry

Compressing them over the network: Which compression algorithm, if any, will we use? What is the availability, configurability, and efficacy of each? ?️ Plotted on the same horizontal axis of 1.6s, the waterfalls speak for themselves: 201ms of cumulative latency; 109ms of cumulative download. Read the complete test methodology.

Cache 291
article thumbnail

How To Measure the Network Impact on PostgreSQL Performance

Percona

We often forget or take for granted the network hops involved and the additional overhead it creates on the overall performance. TCP/IP connection, triggered me to write about other aspects of network impact on performance. How to detect and measure the impact There is no easy mechanism for measuring the impact of network overhead.

Network 61
article thumbnail

Snap: a microkernel approach to host networking

The Morning Paper

Snap: a microkernel approach to host networking Marty et al., This paper describes the networking stack, Snap , that has been running in production at Google for the last three years+. The desire for CPU efficiency and lower latencies is easy to understand. SOSP’19. Emphasis mine). It reminds me of ZeroMQ.

Network 92
article thumbnail

Crucial Redis Monitoring Metrics You Must Watch

Scalegrid

Key Takeaways Critical performance indicators such as latency, CPU usage, memory utilization, hit rate, and number of connected clients/slaves/evictions must be monitored to maintain Redis’s high throughput and low latency capabilities. Similarly, an increased throughput signifies an intensive workload on a server and a larger latency.

Metrics 130
article thumbnail

Consistent caching mechanism in Titus Gateway

The Netflix TechBlog

In PACELC terms we choose PC/EC and have the same level of availability for writes of our previous system while improving our theoretical availability for reads. In that scenario, the system would need to deal with the data propagation latency directly, for example, by use of timeouts or client-originated update tracking mechanisms.

Cache 224