Remove Availability Remove Course Remove Infrastructure Remove Java
article thumbnail

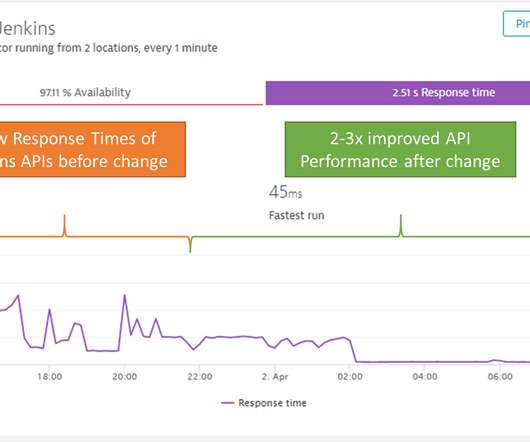
Java memory optimizations: 3x Jenkins performance improvement with Dynatrace

Dynatrace

In my last blog I covered how our Engineering Productivity (EP) and Infrastructure & Services (IAS) Teams are ensuring that our DevOps tool chain is running as expected, even while workloads have shifted as our global engineering teams are now working from home. But let’s start from the beginning: Step #1 – Switching to Java 11.

Java 256
article thumbnail

Extend infrastructure observability with JMX Extensions and additional full-stack metrics

Dynatrace

Infrastructure exists to support the backing services that are collectively perceived by users to be your web application. Issues that manifest themselves as performance degradation on a user’s device can often be traced back to underlying infrastructure issues. Dynatrace news. Monitor additional metrics.

Insiders

Sign Up for our Newsletter

This site is protected by reCAPTCHA and the Google Privacy Policy and Terms of Service apply.

Trending Sources

article thumbnail

A look behind the scenes of AWS Lambda and our new Lambda monitoring extension

Dynatrace

This has led to the recent release of our new Lambda monitoring extension supporting Node.js, Java, and Python. Distributing accounts across the infrastructure is an architectural decision, as a given account often has similar usage patterns, languages, and sizes for their Lambda functions. file uploaded to AWS Lambda.

Lambda 224
article thumbnail

Get out-of-the-box visibility into your ARM platform (Early Adopter)

Dynatrace

Other distributions like Debian and Fedora are available as well, in addition to other software like VMware, NGINX, Docker, and, of course, Java. OneAgent for the ARM platform comes with several deep-code monitoring modules: Java, NGINX, and Node.js. For details on available metrics, see host performance monitoring.

Java 133
article thumbnail

Eliminate inefficiencies and innovate faster by optimizing hybrid mainframe environments on IBM Z

Dynatrace

With the release of Dynatrace 1.194, we’ve added CPU related infrastructure metrics for LPARs (host metrics) and regions (process metrics) and expanded our multidimensional analysis to IBM Z systems, including CICS, IMS, and the CICS transaction gateway. . zIIP eligible time processed on general CPU. Prerequisites.

article thumbnail

The Return of the Frame Pointers

Brendan Gregg

This technique saves two instructions in the prologue and epilogue and makes one additional general-purpose register (%rbp) available." 2014: Java in Flames Broken Java Stacks (2014) When I joined Netflix in 2014, I found Java's lack of frame pointer support broke all application stacks (pictured in my 2014 Surge talk on the right).

Java 145
article thumbnail

It’s time to migrate from NAM to Dynatrace

Dynatrace

But end users kept complaining about slow applications, and despite increasing costs and control over networks, the baseline of end user experience wasn’t available. Application availability and performance measured using network probe technology. In 2012, we anticipated the shifts towards cloud infrastructures and microservices.

Network 166