Remove Availability Remove Blog Remove Monitoring Remove Open Source
article thumbnail

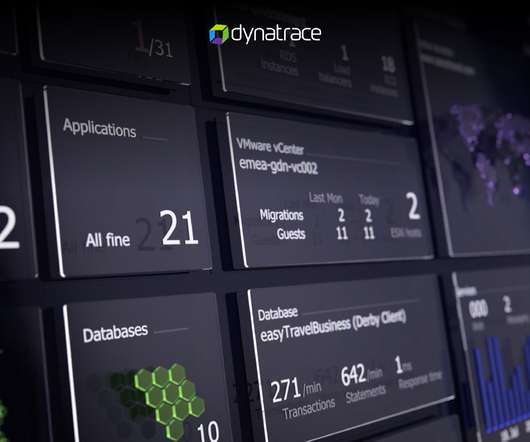
Monitoring-as-code through Dynatrace’s Open-Source Initiative

Dynatrace

Configuring monitoring and observability is no stranger to that paradigm and it was also highlighted in the latest State of DevOps 2020 report. Defining what to monitor and what to be alerted on must be as easy for developers as checking in a monitoring configuration file into version control along with the applications source code.

article thumbnail

Reasons to Choose an Open-Source Test Automation Tool

Testsigma

Open-source software development has grown increasingly popular over the last two decades. Popular OS like Linux and Android; Browsers like Firefox and Chrome; Programming languages like Python and JavaScript; Automation tools like Selenium and Appium; are all Open-Source. Startups are generally budget-challenged.

Insiders

Sign Up for our Newsletter

This site is protected by reCAPTCHA and the Google Privacy Policy and Terms of Service apply.

Trending Sources

article thumbnail

Monitoring a PostgreSQL Patroni Cluster

Percona

Percona Monitoring and Management (PMM) boasts many functionalities that support its extension, be it by using Custom Queries, Custom Scripts, or by collecting data from already available External Exporters. In this short blog post, we will see how to quickly (and easily) monitor a PostgreSQL cluster managed by Patroni.

article thumbnail

Managing High Availability in PostgreSQL – Part III: Patroni

Scalegrid

In our previous blog posts, we discussed the capabilities and functioning of PostgreSQL Automatic Failover (PAF) by Cluster Labs and Replication Manager (repmgr) by 2ndQuadrant. Managing High Availability in PostgreSQL – Part I: PostgreSQL Automatic Failover. Managing High Availability in PostgreSQL – Part II: Replication Manager.

article thumbnail

Manage your monitoring as code with Dynatrace’s HashiCorp Terraform integration

Dynatrace

We’re excited to announce our verified HashiCorp Terraform integration is now available for Dynatrace customers. HashiCorp’s Terraform is an open-source infrastructure as a code software tool that provides a consistent CLI workflow to manage hundreds of cloud services. What is monitoring as code? Dynatrace news.

Code 238
article thumbnail

Monitor your technology stack with Dynatrace and Amazon Managed Service for Prometheus

Dynatrace

Prometheus is an open-source monitoring and alerting toolkit for services and applications that run in containers. You can easily extract Prometheus metrics from AMP into your Dynatrace Managed or SaaS environment and make them available for further analysis, charting, and alerting. Dynatrace news.

article thumbnail

PMM Dump GUI in Percona Monitoring and Management 2.41.0

Percona

A couple of weeks ago, we announced the first GA release of the PMM Dump : a new support tool that dumps Percona Monitoring and Management (PMM) metrics and Query Analytics (QAN) data to transfer to the expert engineer for review and performance suggestions. That blog introduced a command-line interface. A week later, PMM 2.0.41.0