Remove Analytics Remove Event Remove Metrics Remove Software Engineering
article thumbnail

How platform engineering and IDP observability can accelerate developer velocity

Dynatrace

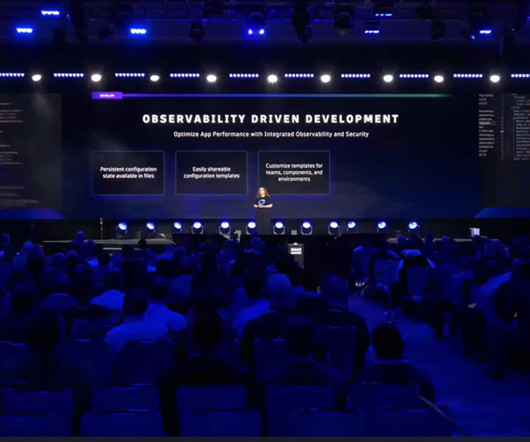
During a breakout session at the Dynatrace Perform 2024 conference, Dynatrace DevSecOps activist Andreas Grabner and staff engineer Adam Gardner demonstrated how to use observability to monitor an IDP for key performance indicators (KPIs). Furthermore, OneAgent observes and gathers all remaining workload logs, metrics, traces, and events.

article thumbnail

Why applying chaos engineering to data-intensive applications matters

Dynatrace

Stream processing One approach to such a challenging scenario is stream processing, a computing paradigm and software architectural style for data-intensive software systems that emerged to cope with requirements for near real-time processing of massive amounts of data. This significantly increases event latency.

Insiders

Sign Up for our Newsletter

This site is protected by reCAPTCHA and the Google Privacy Policy and Terms of Service apply.

Trending Sources

article thumbnail

Conducting log analysis with an observability platform and full data context

Dynatrace

Causal AI—which brings AI-enabled actionable insights to IT operations—and a data lakehouse, such as Dynatrace Grail , can help break down silos among ITOps, DevSecOps, site reliability engineering, and business analytics teams. Logs are automatically produced and time-stamped documentation of events relevant to cloud architectures.

Analytics 193
article thumbnail

OpenTelemetry observability and Dynatrace deliver actionable answers at scale

Dynatrace

Different monitoring point solutions, such as Jaeger, Zipkin, Logstash, Fluentd, and StatsD, each have their own way of observing and recording such an event. But, as Justin Scherer, senior software engineer from Northwestern Mutual found, OpenTelemetry by itself is not a panacea. What is OpenTelemetry?

article thumbnail

Unlock the Power of DevSecOps with Newly Released Kubernetes Experience for Platform Engineering

Dynatrace

Platform engineering is on the rise. According to leading analyst firm Gartner, “80% of software engineering organizations will establish platform teams as internal providers of reusable services, components, and tools for application delivery…” by 2026. Open source logs and metrics take precedence in the monitoring process.

article thumbnail

AWS observability: AWS monitoring best practices for resiliency

Dynatrace

Like general observability , AWS observability is the capacity to measure the current state of your AWS environment based on the data it generates, including its logs, metrics, and traces. Lambda is Amazon’s event-driven, functions-as-a-service (FaaS) compute service that runs code when triggered for application and back-end services.

article thumbnail

Automating Success: Building a better developer experience with platform engineering

Dynatrace

Check out the following use cases to learn how to drive innovation from development to production efficiently and securely with platform engineering observability. When releasing into production, Gardner said it’s important to think beyond performance metrics. And that’s where lifecycle events come in.