
Alerting profiles are a great way of filtering all Dynatrace detected problems based on their severity levels or problem duration before alerts are triggered. My previous blog post, Efficiently filter problem notifications with alerting profiles, described usage of alerting profiles and the use cases for which they can be implemented.
With this Dynatrace release, we’ve further improved the capabilities of your alerting profiles to allow you to define more fine-grained filtering options based on the event types within correlated problems. Particularly for auto-remediation use cases, it’s helpful to trigger specific actions based on detailed information that’s captured during abnormal situations. An example is triggering alerts in cases where problems are related to process crashes.
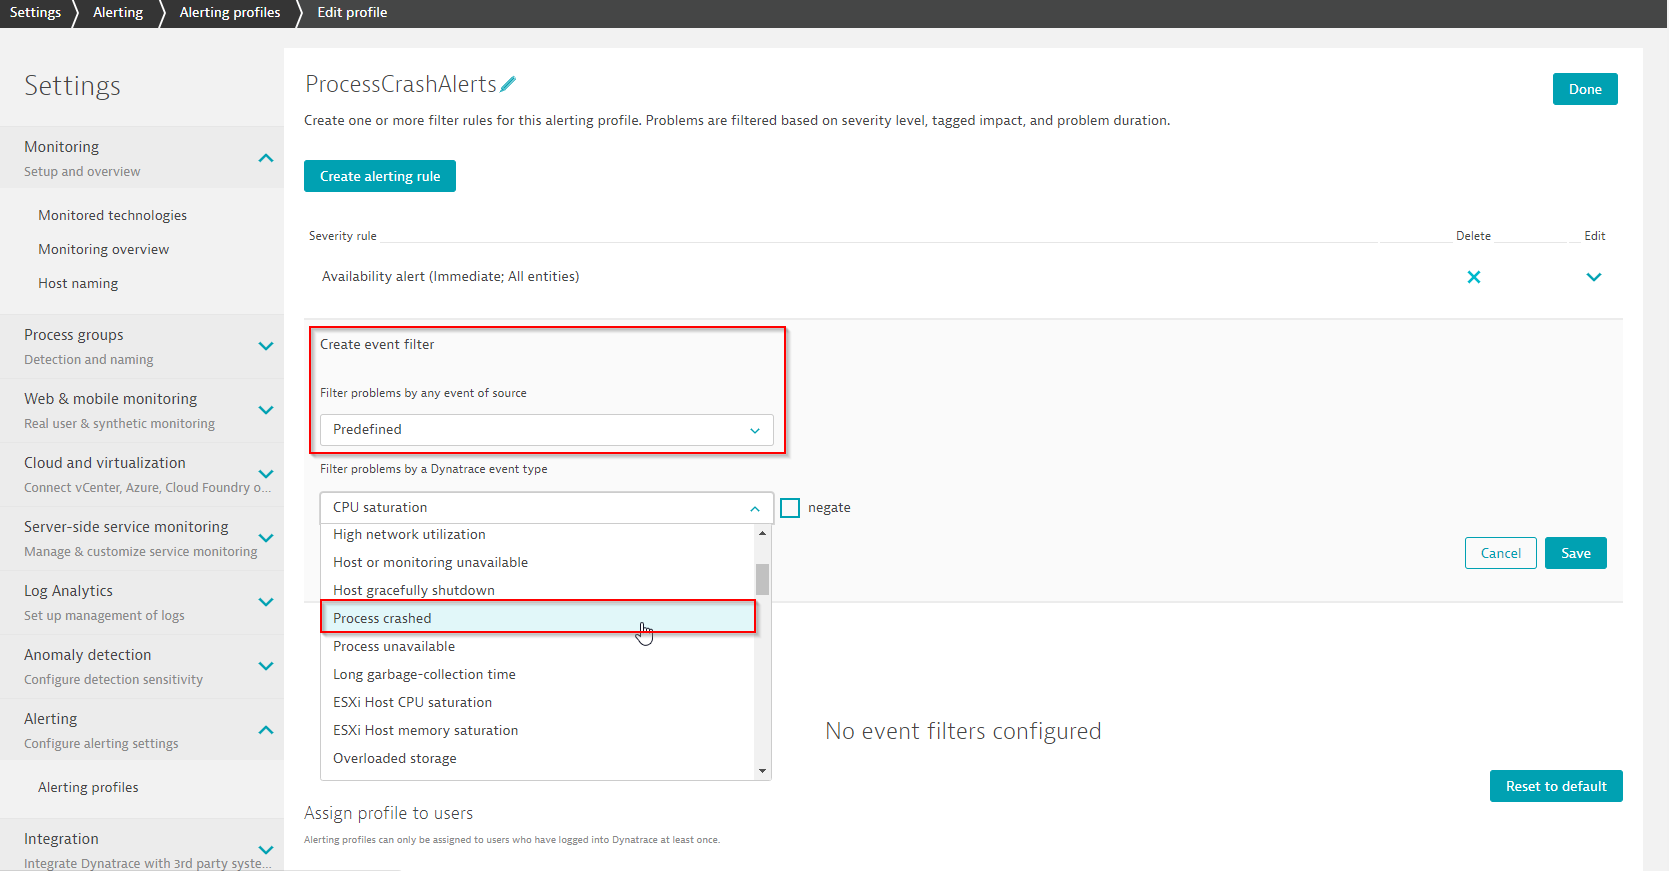
In the previous version of alerting profiles the ‘Availability’ problem filter was the only option for focusing on availability-related problems. By adding a more fine-grained filter for process crash event types, you can now focus on all problems that only contain a process crash.
The example below shows how to define a process crash filter within an alerting profile:
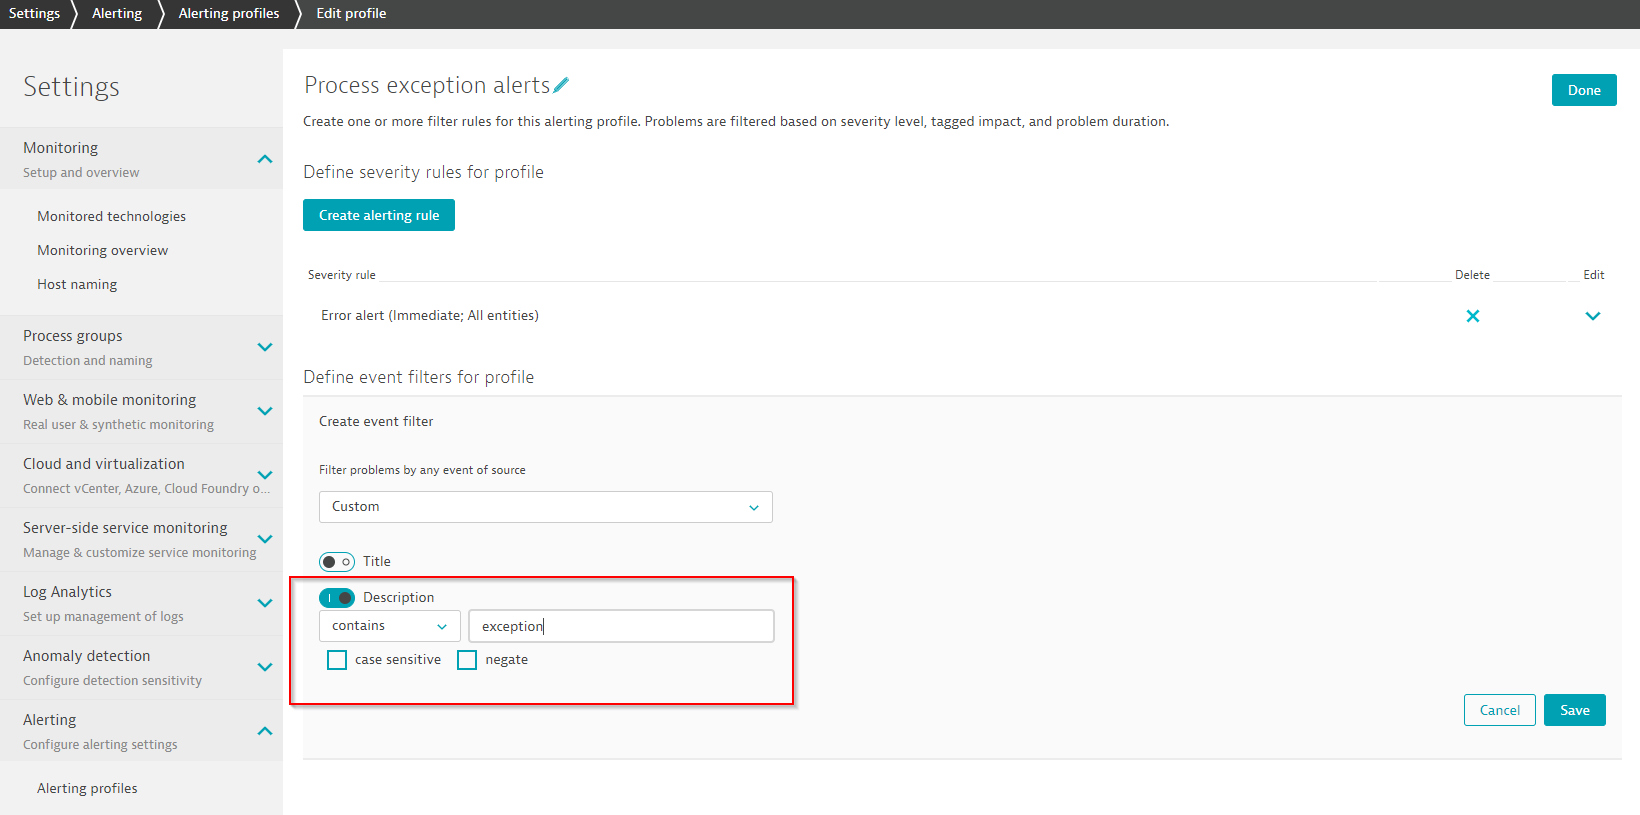
Another improvement is the possibility to filter for custom events that contain a user-defined string either within the title or within the description of the event. Custom event types include events that originate from plugins, APIs, or Log Analytics.
For example, you can filter for all plugin events that contain the string exception, as shown in the screenshot below:
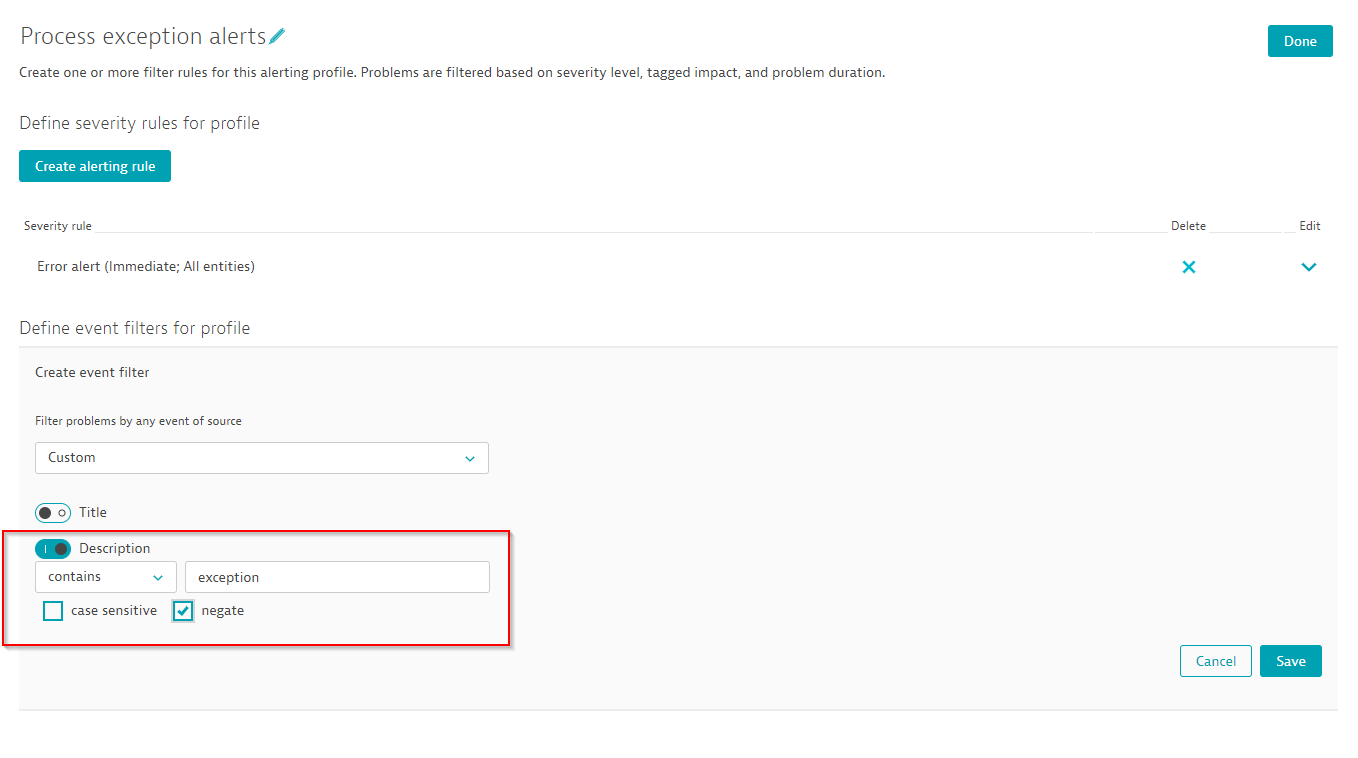
Every event string filter can be case-sensitive or case-insensitive, as well as inverted. The inverted semantic of the above filtering rule would filter for all custom events that don’t contain the string exception within the event description. See example below with the Negate option selected:
Using the newly introduced alerting profile event filters, it’s now possible to further refine your problem filters within each severity level. So instead of getting all types of availability type of problems, you can now focus on a subset of specific problem situations, such as process crashes or individual log events.
These more fine-grained alerting profile filters help to implement automation task, such as triggering Ansible Tower playbook scripts that can react on selected situations within your monitored system.


Looking for answers?
Start a new discussion or ask for help in our Q&A forum.
Go to forum