
Are you applying AI to the unique metrics and KPIs that matter most to the success of your digital business? Do you provide dashboards and analytics that combine technical and business metrics that are specific to your business? Do you leverage the request attributes of your business-critical services for unmatched insights? If not, read on to learn how Dynatrace can now help you enrich your monitoring insights with custom metrics for services.
Dynatrace extends AI-powered answers to custom technical and business KPIs for services
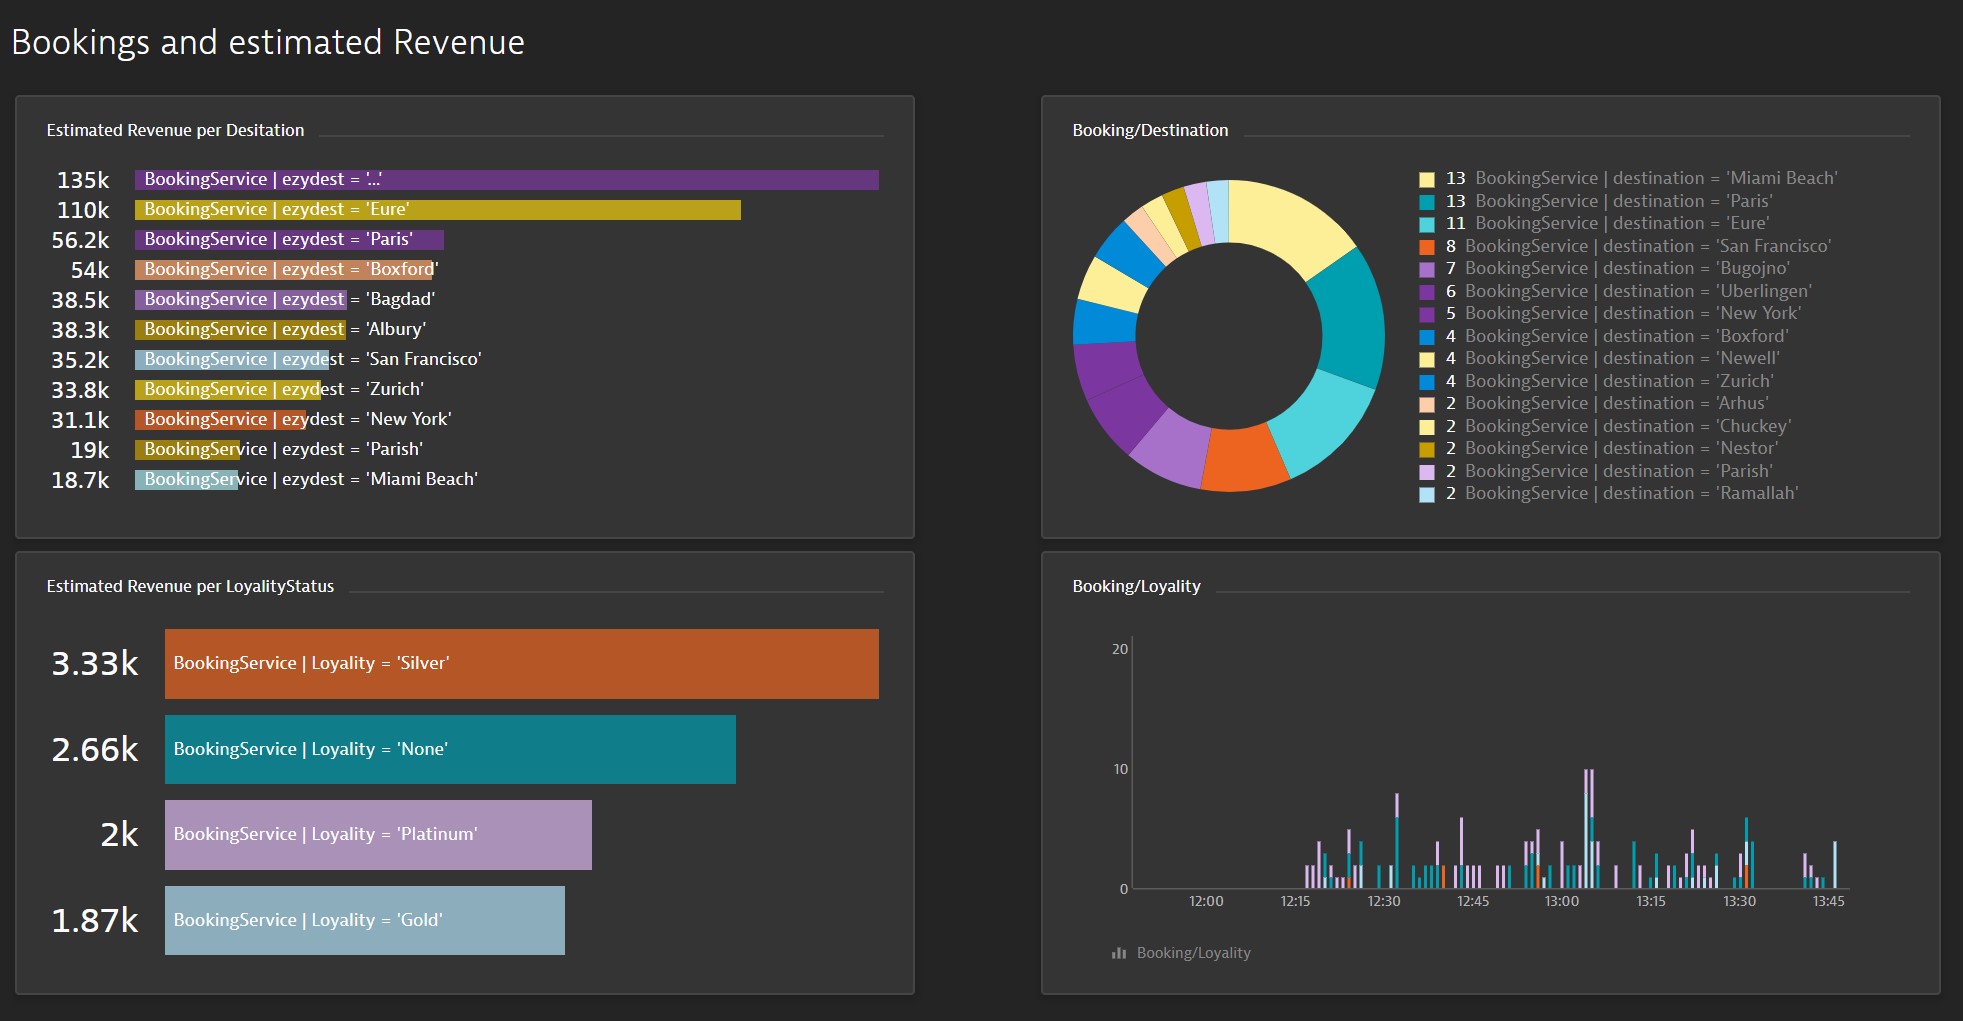
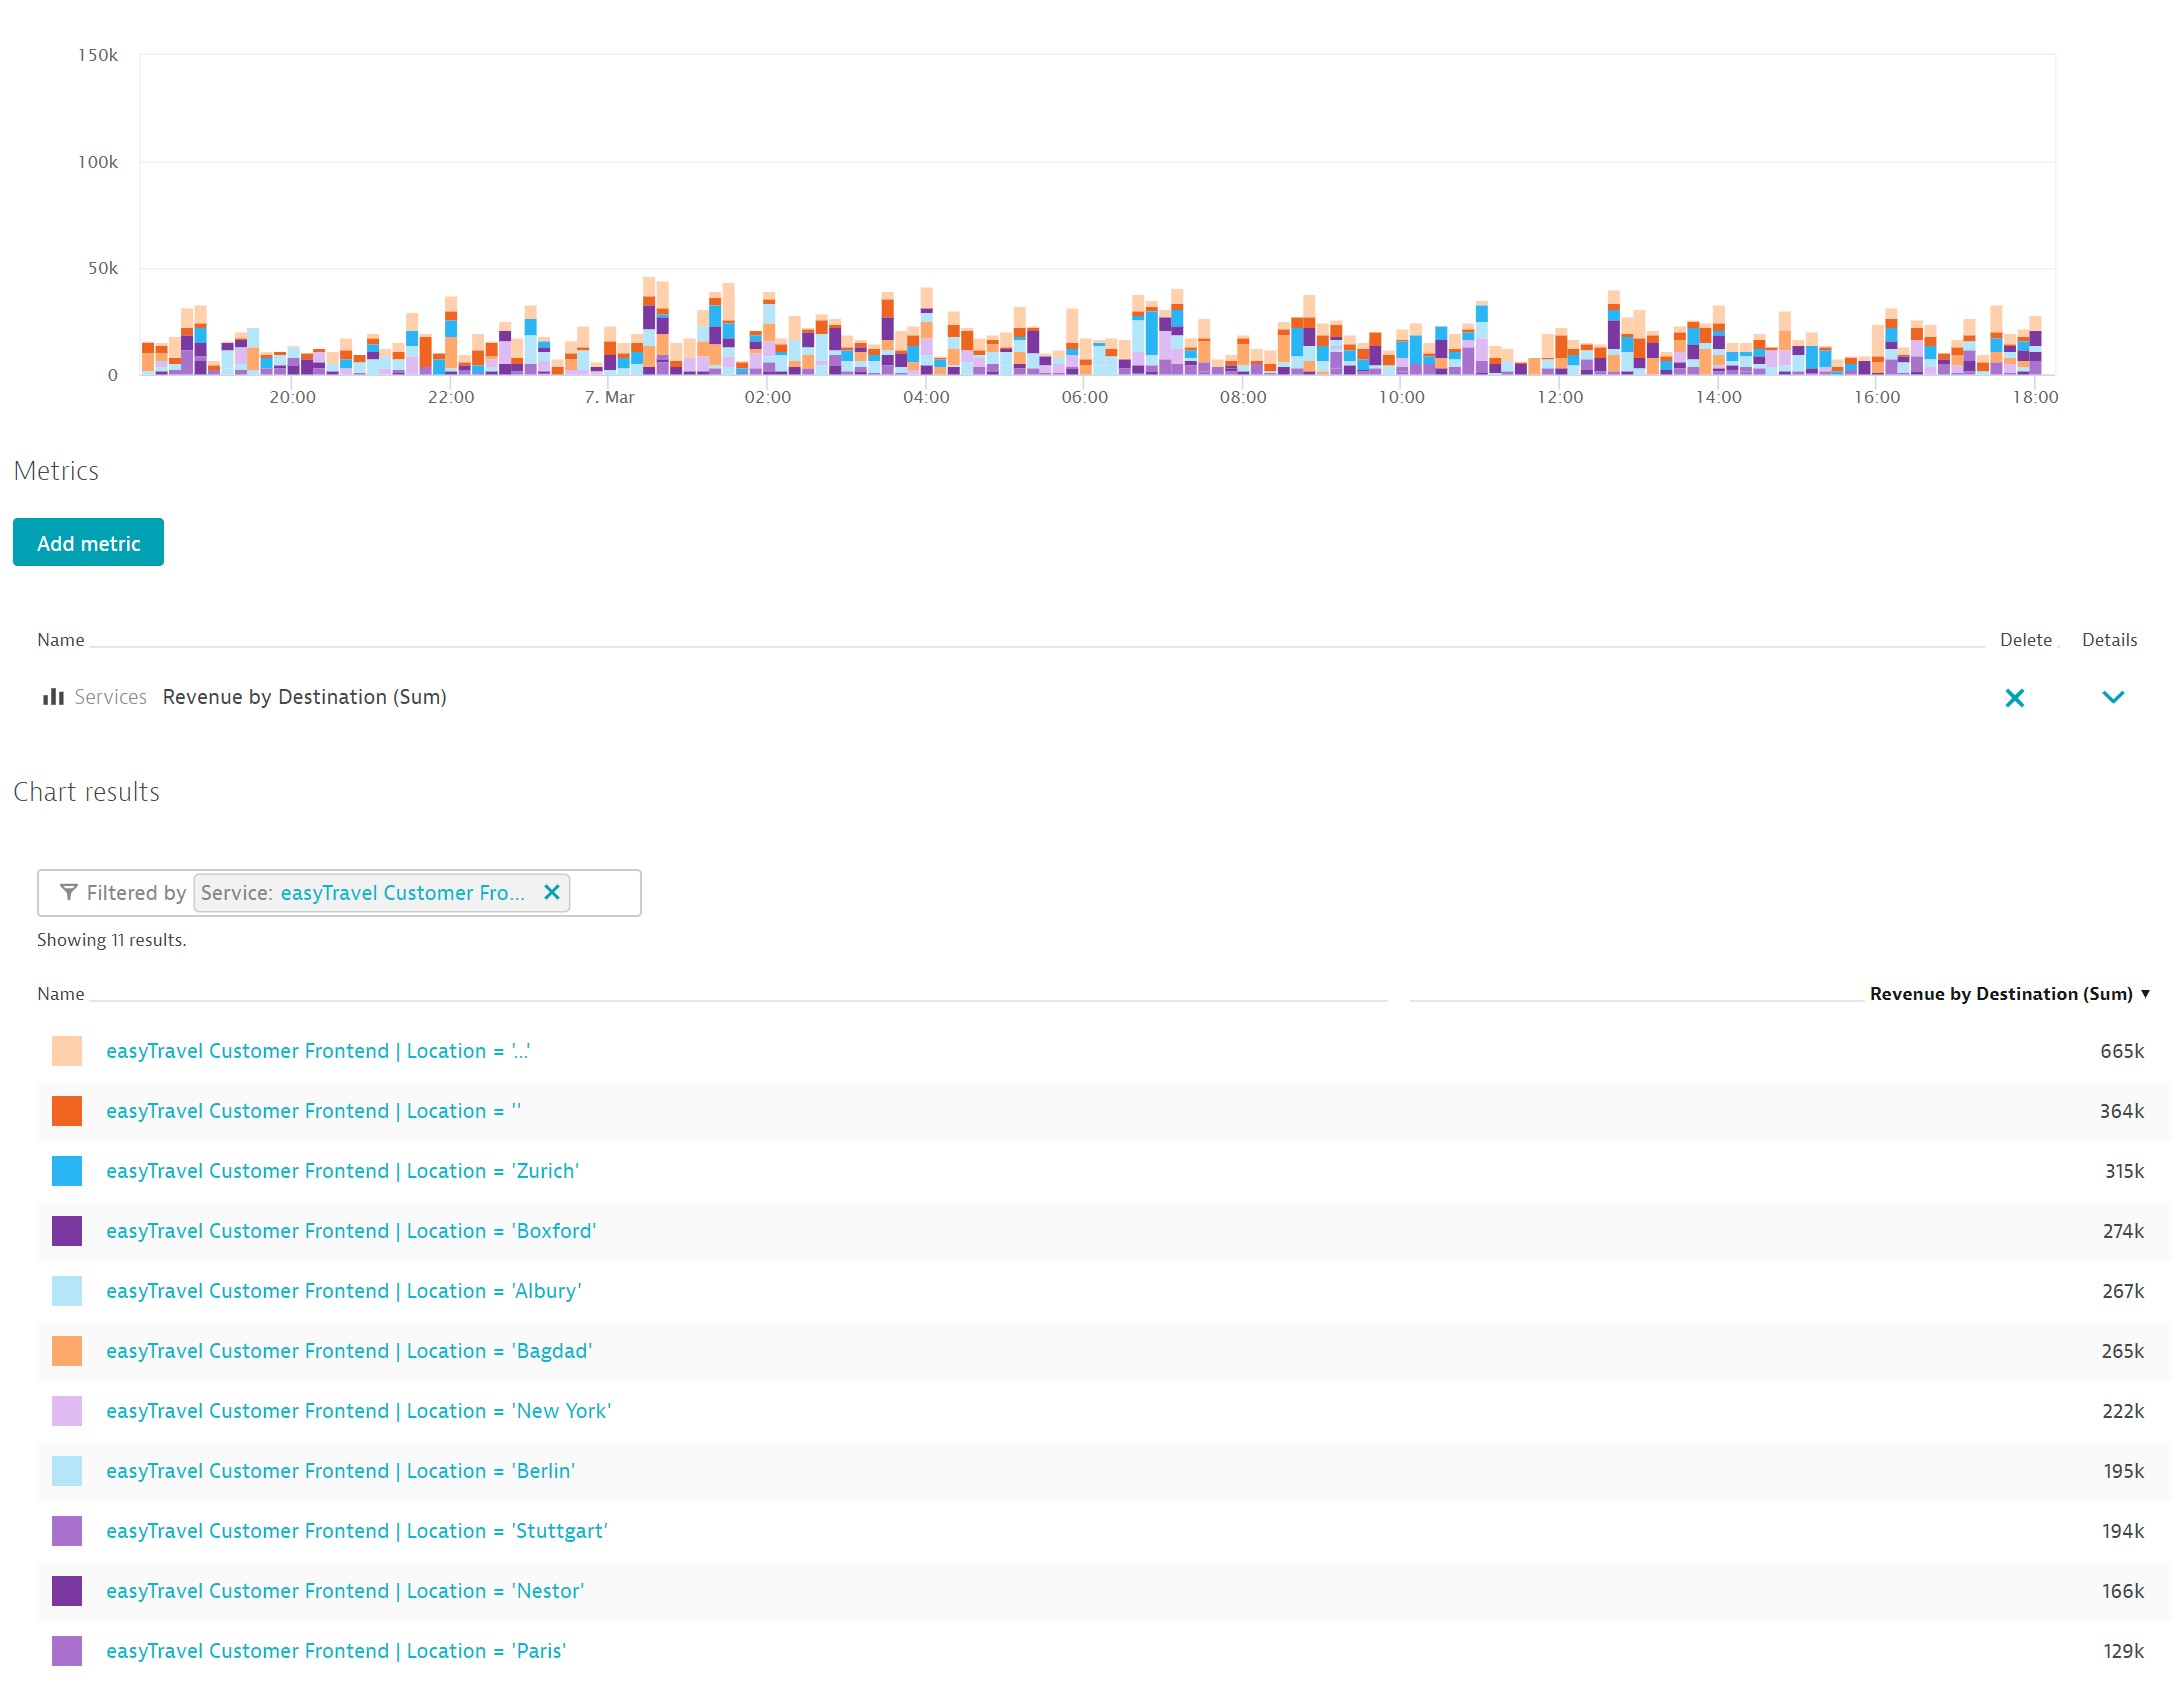
Dynatrace out-of-the-box metrics generally focus on availability, failure rate, and performance. Of course, there are many other use cases for service metrics that are specific to a particular service, a particular customer, or for whatever reason have significant relevance for your business. For example, a ride-hailing company might want to keep track of the number of active drivers per region, or the average ride distance, and be alerted on significant anomalies. The example below shows how a travel agency might chart the revenue trends of their most popular travel destinations. The possibilities for analysis, charting, and reporting on your most important pages are almost endless.
Monitoring, trending, alerting, and automated root-cause analysis for custom metrics
Months ago, Dynatrace introduced the multidimensional analysis view for service and custom metrics that enables you to define custom analysis views around use cases that leverage request attributes as metric sources. Now, Dynatrace is announcing a Preview for monitoring, trending, alerting, and automated root-cause analysis based on custom metrics for services. In particular, Dynatrace now delivers:
- Dashboarding and charting for request attributes
- Charting of response time and request count for the top 100 URLs
- Alerting on request attribute-based metrics
- Extension of the root-cause analysis of Davis®, the Dynatrace AI engine, to custom metrics
- Accessing custom metrics based on request attributes via API
Licensing
For this Preview, the new metrics will be available at no charge. Once released, these metrics will be treated just like custom metrics (available through the purchase of a Data ingest & Analytics package).
Setup
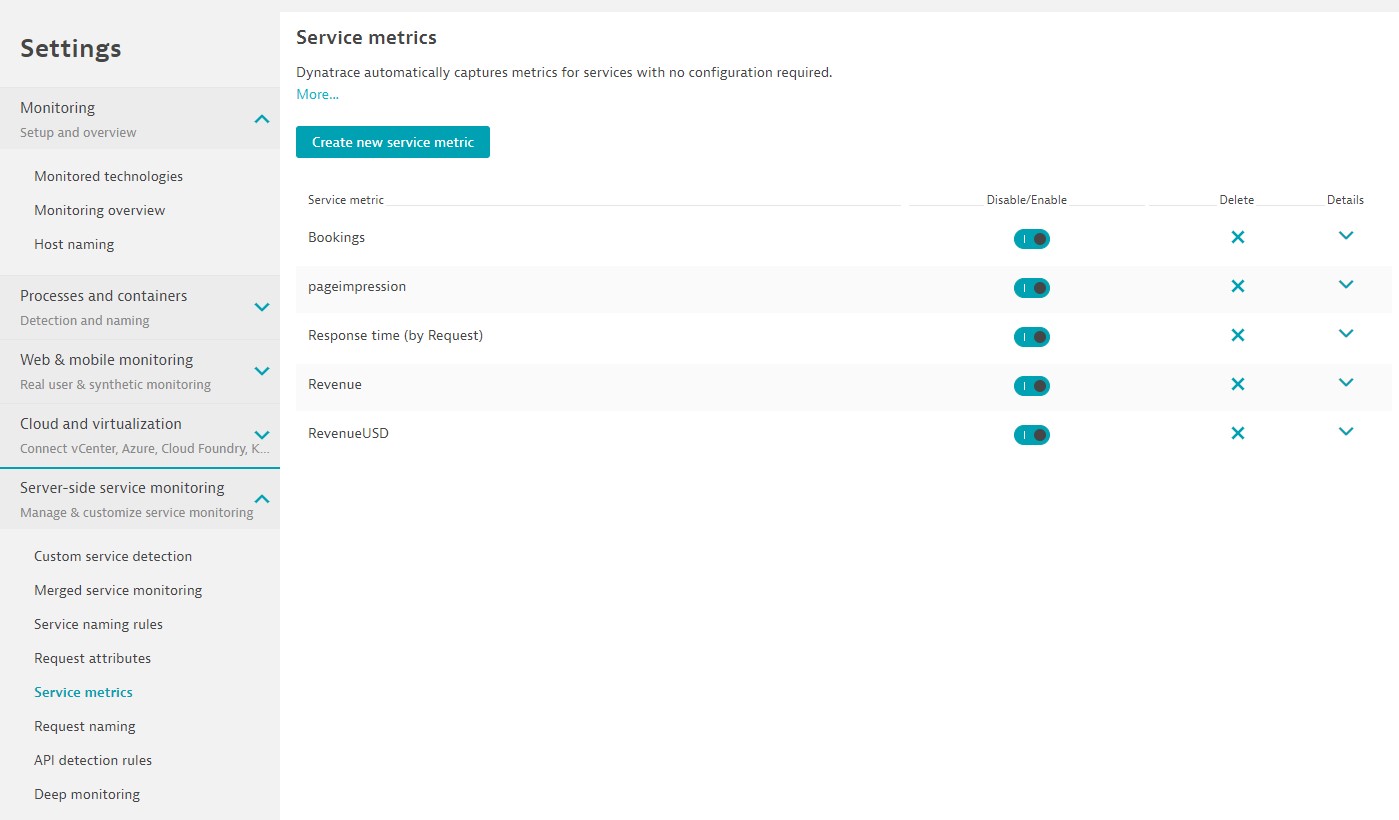
Once the Preview has been activated for your environment, you’ll see a new Service metrics entry in the Server-side service monitoring settings menu.
The first thing to do when defining a new metric is to define the source of the metric’s value. The source can be existing metrics, the new metrics we’ve just added, or a request attribute. Examples include:
- Response time
- Request count
- Successful request count
- Failed request count
- Failure rate
- HTTP 4xx count
- HTTP 5xx count
- CPU time
- IO time
- Wait time
- Lock time
- Calls to database
- Time spent in calls to database
- Calls to other services
- Time spent in calls to other services
- Request attribute
At the moment only request attribute with numerical value are available, however you can also count requests that have certain request attributes.
You can define a set of conditions that tell Dynatrace which requests (and implicitly which services) it should take into account when calculating the new metric. Have a look at the following example.
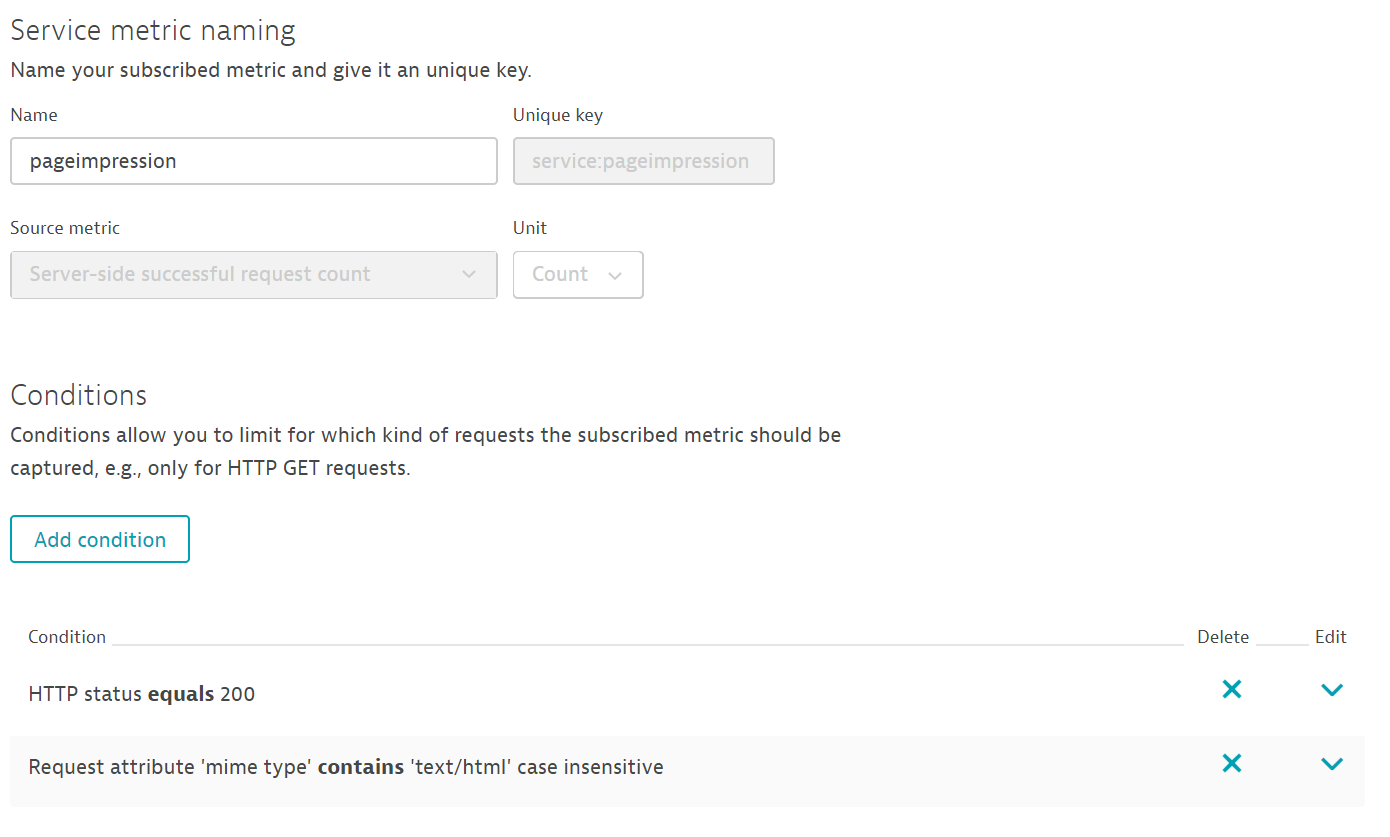
This metric calculates the number of successful requests (as defined by the respective service failure detection) with the HTTP status code 200 (which is implicitly only web requests and web services) that have a request attribute mime type with the value text/html. It should come as no surprise that this request attribute is based on the HTTP response header mime-type. In other words, this metric calculates the number of successfully delivered HTML pages, usually called page impressions.
The only thing left to do is to give the metric a display name and a unique metric key. The metric key is important as it can’t be changed later. It’s used to store the timeseries and request it via the Dynatrace API.
Once saved, this metric is continuously calculated for all incoming requests that fit the conditions. This metric produces a timeseries for every service that contains requests that fit the conditions, which, in this example, means any web request that successfully delivers HTML pages.
As with all other timeseries, a value is collected each minute. In the case of values that aren’t counts (for example, request counts), the metric calculates a minimum, maximum, average, sum, and count of the metric’s original value each minute.
What you can now achieve
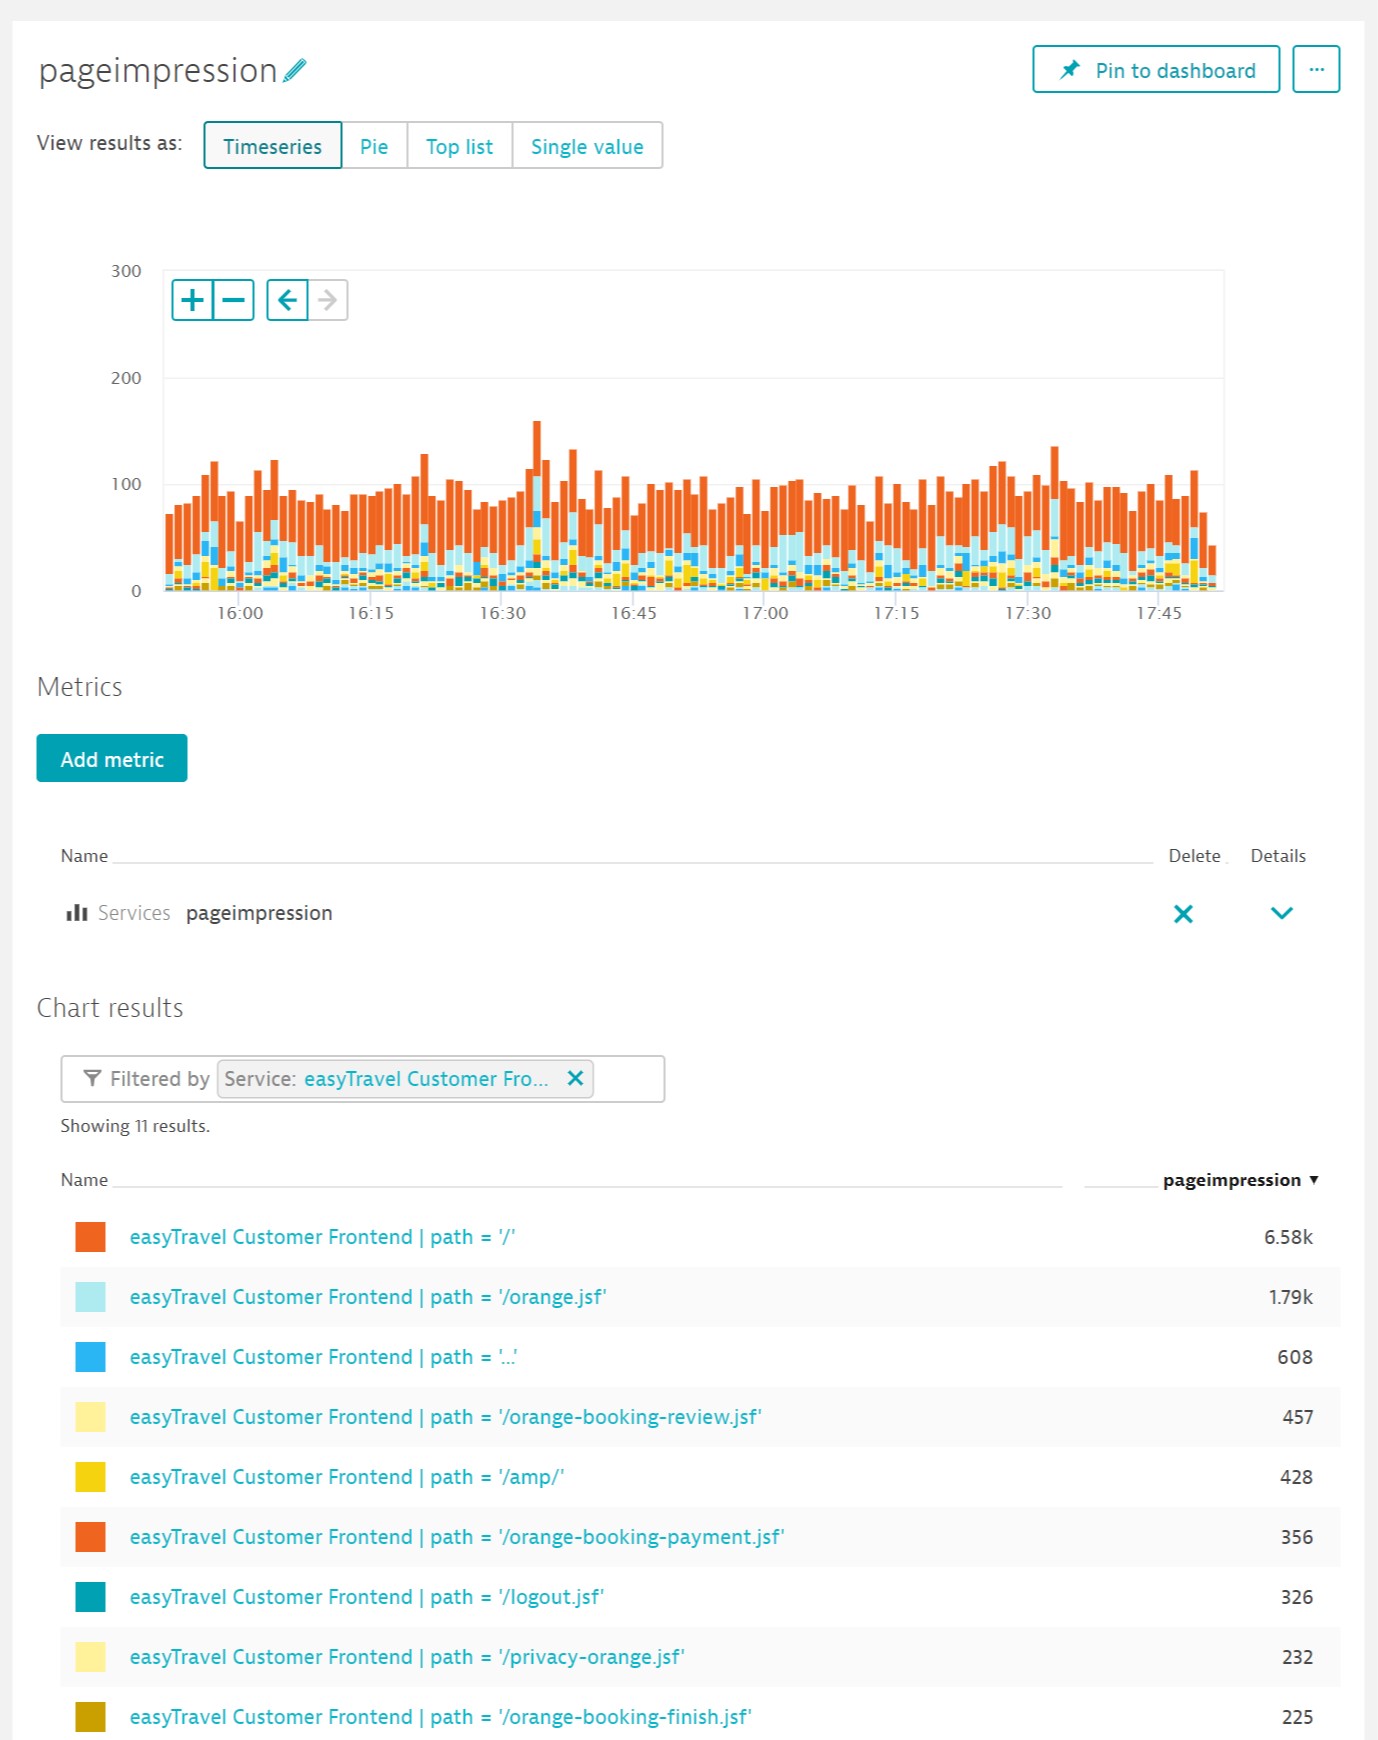
As you might expect, you can now use this timeseries in custom charts that can be pinned to your dashboards.
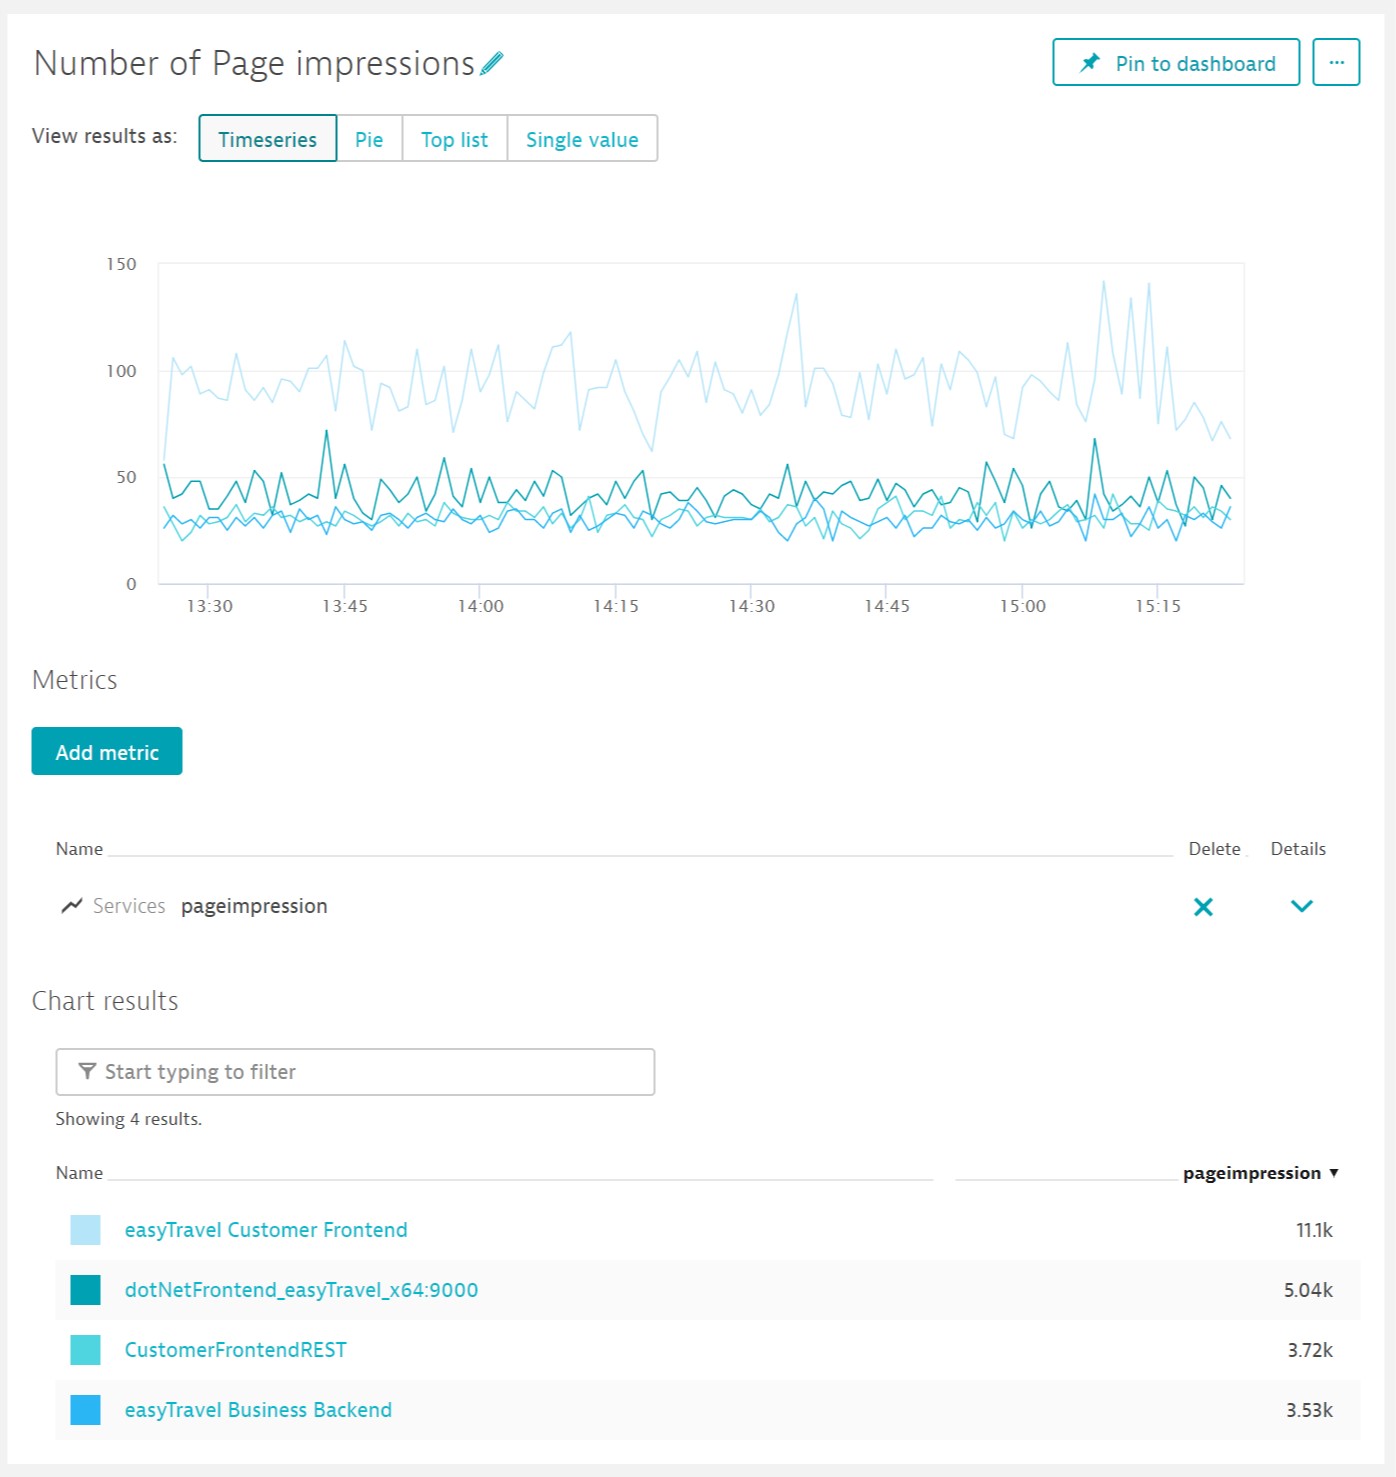
Notice that the timeseries exists on multiple services. This is because of the conditions that were defined for this example. All web request services (due to the HTTP status code condition we set up) that have the mime type request attribute text/html feature this new metric. You can add further conditions to the metric definition to limit the metric to a specific set of services or to a single service.
There’s more…
A metric alone can only say so much. It’s important to understand what each metric relates to. Dynatrace built-in service metrics relate to both the related services and the respective key requests. User-defined analytics metrics allow you to define an additional dimension, for example, based on URL break down (see the pageimpression metric example below).
Metric dimensions aren’t restricted to URLs; you can use any parameter that is available for request naming rules. This includes all the usual service properties, request properties, and any request attribute.
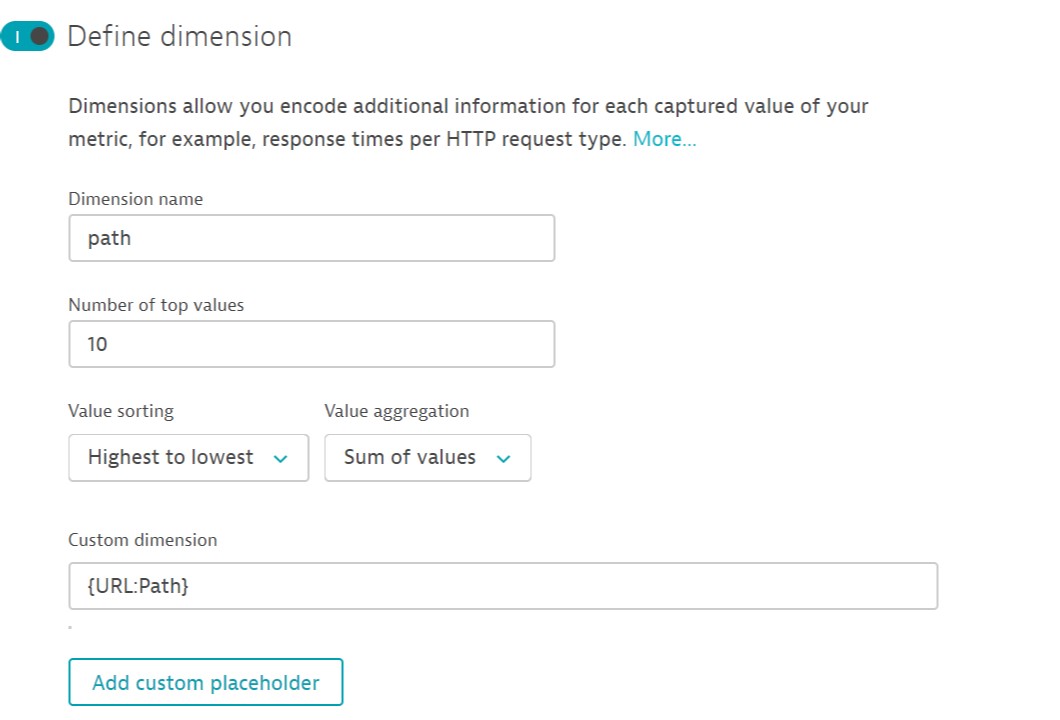
You can freely define the pattern of custom dimensions, not only by choosing one of the request properties or request attributes, but also by combining them.
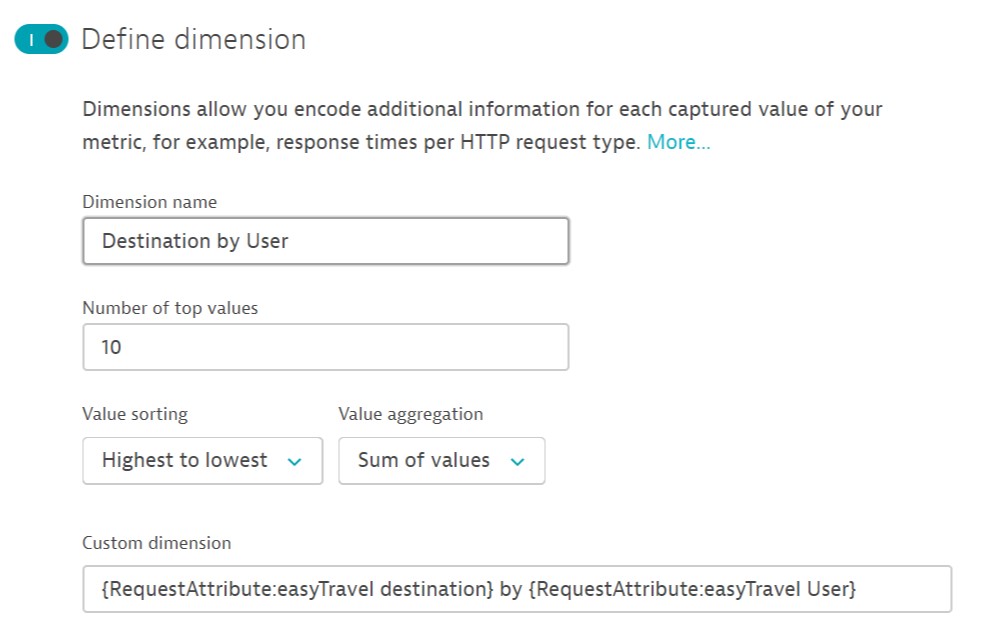
This should look familiar; the same logic is used for Dynatrace request naming rules.
Custom dimensions give this feature tremendous power. However, with great power comes great responsibility! You may have a lot of dimensions, but typically you’ll be interested in only a small subset of these dimensions. In fact, you’ll typically be interested only in a specific use case (for example, the 10 URLs that have the most page impressions). This is exactly what you configure and Dynatrace does the rest. Dynatrace calculates the 10 URLs with the most page impressions each minute. This enables you too look at trends over a long period of time and create reports accordingly.
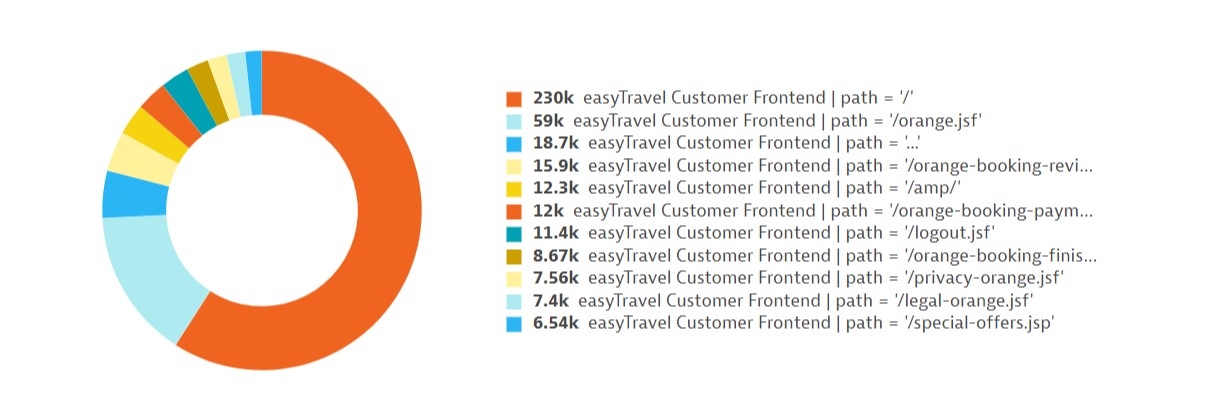
You now have near limitless options for analyzing, charting, and reporting on your most important pages and use cases.
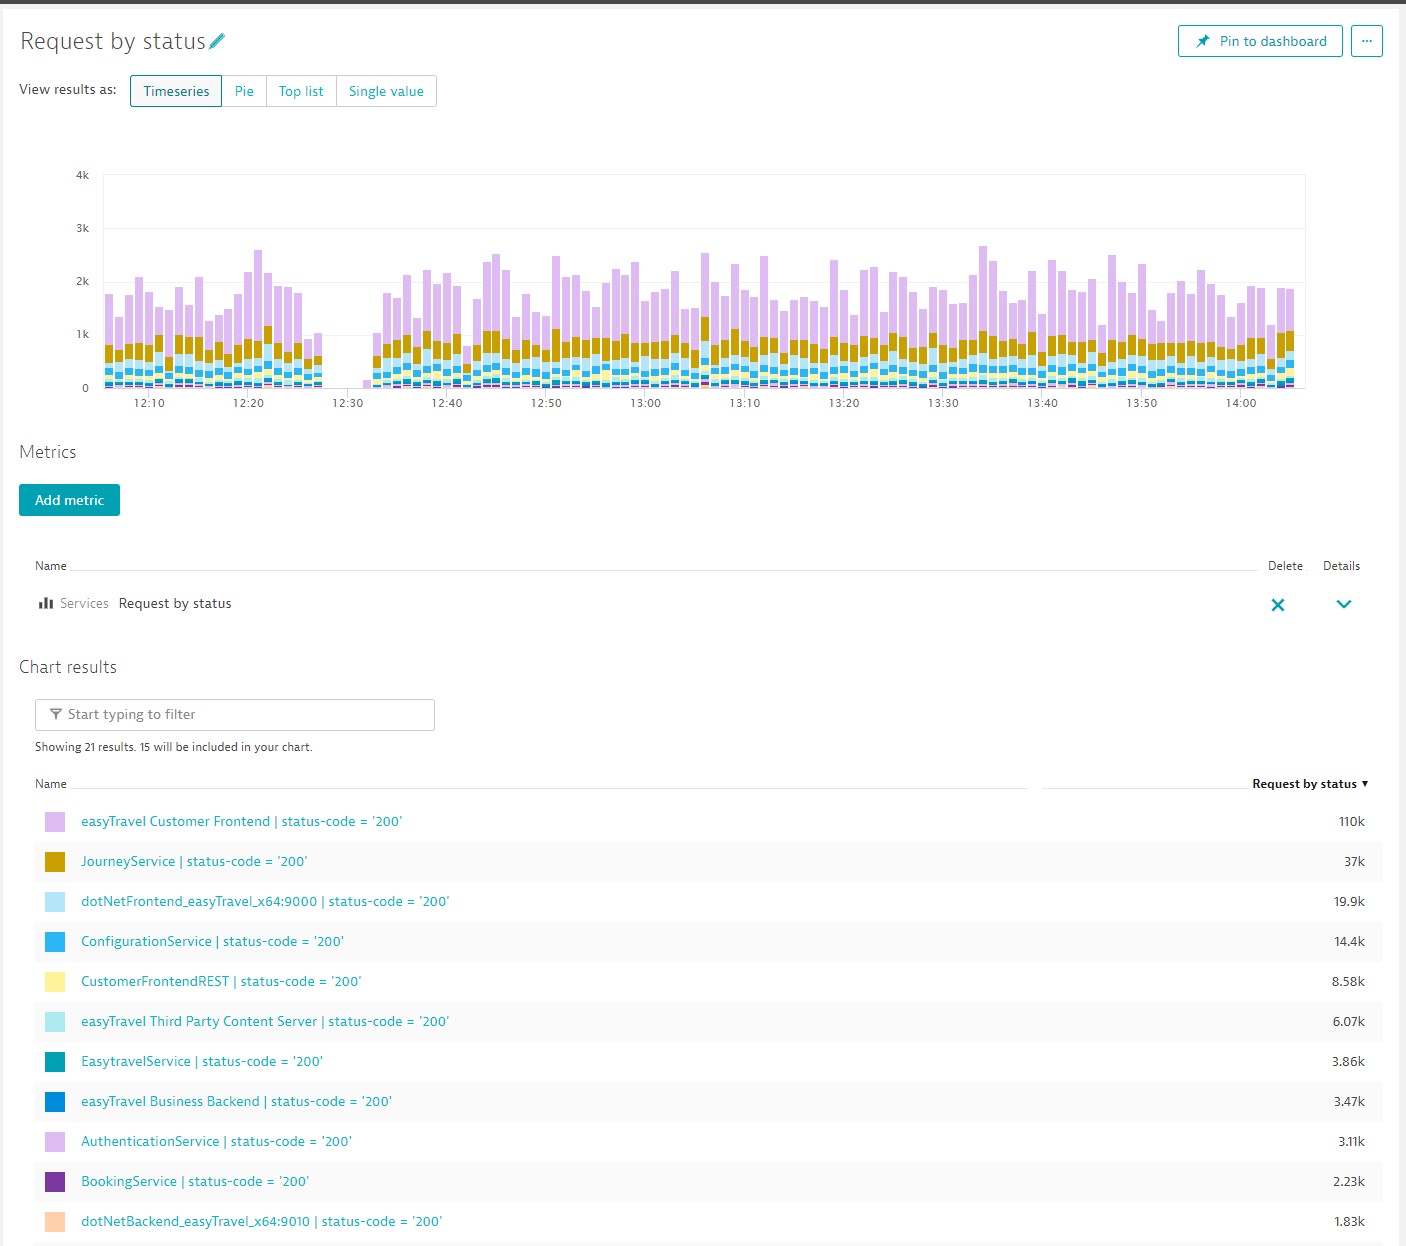
You can also chart the number of requests based on HTTP status code…
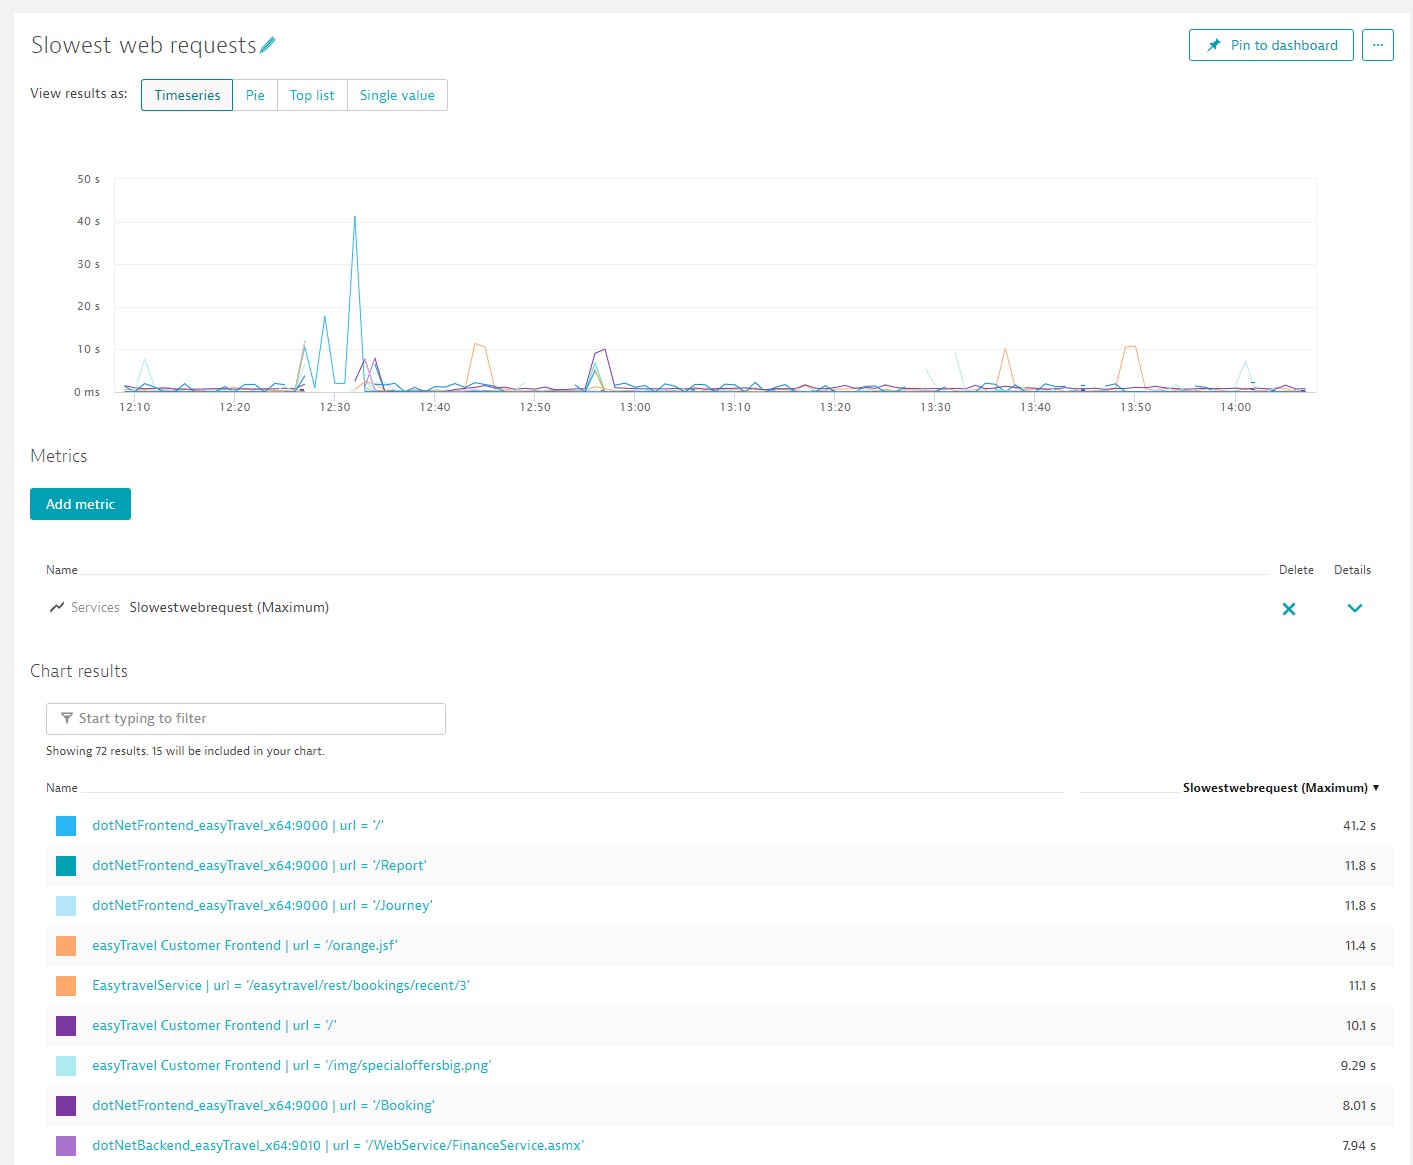
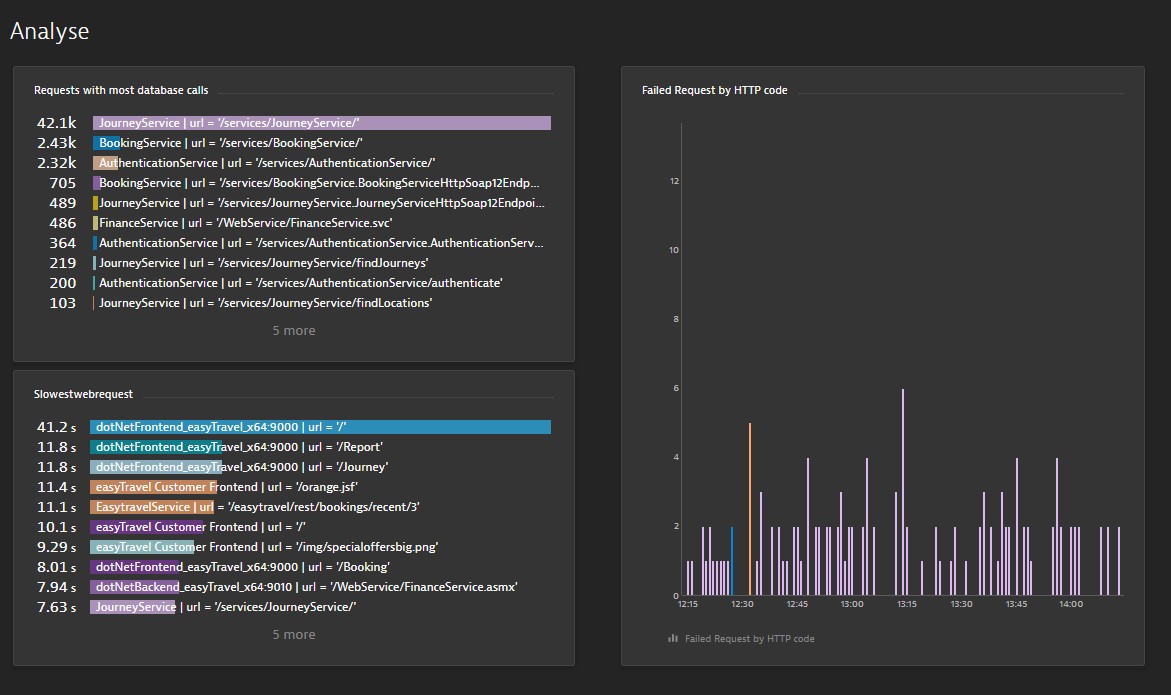
The 10 slowest web requests…
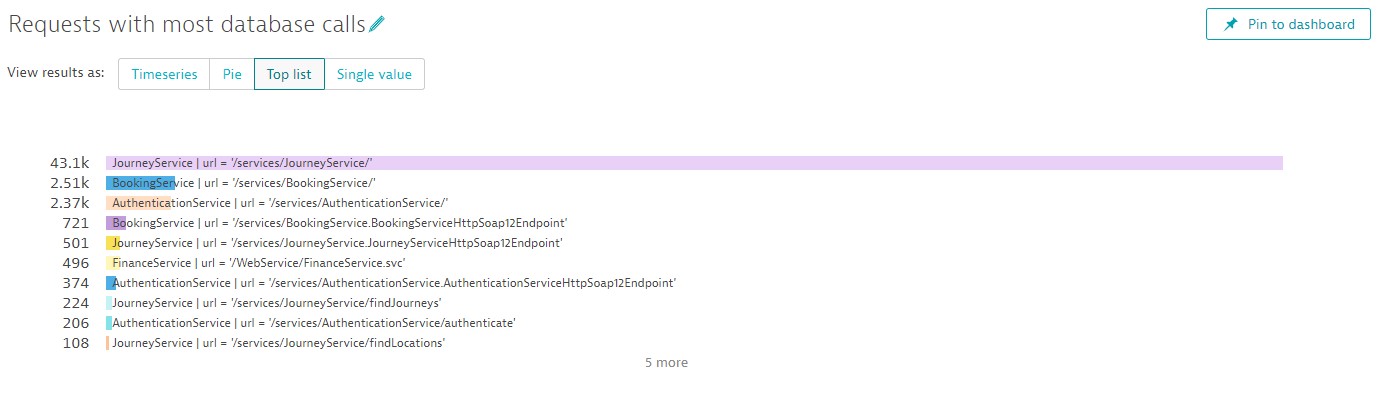
… or the requests that have the most database calls.
And, of course, you can put them all on charts and directly into your dashboards.
How to get access
This feature is currently in a preview and we’d love to receive your feedback. If you’re interested and have a good use case, please register for this Preview. Be aware that Dynatrace Managed installations need to be updated to version 1.168 in order to participate.
What’s next?
There are more features to come before this functionality becomes publicly available. Here’s what’s next:
- Ability to set custom alerts
- Ability to access these metrics via the API
- Extended conditions on the metrics, for example, response time condition to allow for SLA metrics
- Extended conditions on the metrics to allow restricting of a metric to a particular process and process group
- Ability to specify the real user application name as a dimension
More importantly, we’re working on a complete overhaul of our popular multidimensional analysis view. Our goal is to provide a WYSIWYG graphical means of defining metrics. Stay tuned for details.


Looking for answers?
Start a new discussion or ask for help in our Q&A forum.
Go to forum