Remove Analysis Remove Analytics Remove Benchmarking Remove Latency
article thumbnail

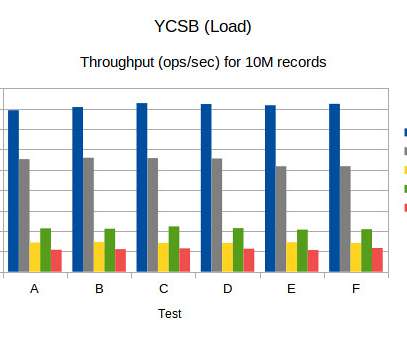
Benchmark (YCSB) numbers for Redis, MongoDB, Couchbase2, Yugabyte and BangDB

High Scalability

This is guest post by Sachin Sinha who is passionate about data, analytics and machine learning at scale. We note that for MongoDB update latency is really very low (low is better) compared to other dbs, however the read latency is on the higher side. Again Yugabyte latency is quite high. Author & founder of BangDB.

article thumbnail

Why applying chaos engineering to data-intensive applications matters

Dynatrace

ShuffleBench i s a benchmarking tool for evaluating the performance of modern stream processing frameworks. Stream processing systems, designed for continuous, low-latency processing, demand swift recovery mechanisms to tolerate and mitigate failures effectively. This significantly increases event latency.

Insiders

Sign Up for our Newsletter

This site is protected by reCAPTCHA and the Google Privacy Policy and Terms of Service apply.

Trending Sources

article thumbnail

Implementing service-level objectives to improve software quality

Dynatrace

Instead, they can ensure that services comport with the pre-established benchmarks. Establish realistic SLO targets based on statistical and probabilistic analysis. This process includes benchmarking realistic SLO targets based on statistical and probabilistic analysis from Dynatrace. SLOs improve software quality.

Software 269
article thumbnail

How BizDevOps can “shift left” using SLOs to automate quality gates

Dynatrace

Quality gates are benchmarks in the software delivery lifecycle that define specific, measurable, and achievable success criteria a service must meet before moving to the next phase of the software delivery pipeline. For example, improving latency by as little as 0.1 latency is the number one reason consumers abandon mobile sites.

article thumbnail

Edgar: Solving Mysteries Faster with Observability

The Netflix TechBlog

Edgar helps Netflix teams troubleshoot distributed systems efficiently with the help of a summarized presentation of request tracing, logs, analysis, and metadata. With request tracing and additional data from logs, events, metadata, and analysis, Edgar is able to show the flow of a request through our distributed system?

Latency 296
article thumbnail

MySQL Key Performance Indicators (KPI) With PMM

Percona

Number of slow queries recorded Select types, sorts, locks, and total questions against a database Command counters and handlers used by queries give an overall traffic summary Along with this, PMM also comes with Query Analytics giving much detailed information about queries getting executed.

article thumbnail

The Surprising Effectiveness of Non-Overlapping, Sensitivity-Based Performance Models

John McCalpin

With a staff of slightly over 175 full-time employees (less than 1/2 in consulting roles), we must therefore focus on highly-leveraged performance analysis projects, rather than labor-intensive ones. Here I assumed a particular analytical function for the amount of memory traffic as a function of cache size to scale the bandwidth time.